Waste and Cleanup Risk Assessment
- You are here: EPA Home
- OLEM
- Superfund
- Superfund Risk Assessment
- Risk Assessment Home
- Human Health Risk Assessment Tools and Databases
- Preliminary Remediation Goals for Radionuclides
Preliminary Remediation Goals for Radionuclides (PRG)
You will need Adobe Reader to view some of the files on this page. See EPA's PDF page to learn more.
PRG User's Guide
Welcome to the EPA's "Preliminary Remediation Goals for Radionuclide Contaminants at Superfund Sites" (PRG) user's guide. Here you will find descriptions, equations and default exposure parameters used to calculate the risk-based PRGs. Additional guidance is also provided on sources of parameters and proper PRG use. It is suggested that users read the PRG FAQ page before proceeding. The user guide is extensive so please use the "Open All Sections" and "Close All Sections" links below as needed. Individual sections can be opened and closed by clicking on the section titles. Before proceeding through the user's guide please read the Disclaimer.
This guidance document sets forth EPA's recommended approaches based upon currently available information with respect to risk assessment for response actions at Comprehensive Environmental Response, Compensation, and Liability Act (CERCLA) sites (commonly known as Superfund). This document does not establish binding rules. Alternative approaches for risk assessment may be found to be more appropriate at specific sites (e.g., where site circumstances do not match the underlying assumptions, conditions and models of the guidance). The decision whether to use an alternative approach and a description of any such approach should be documented. Accordingly, when comments are received at individual sites questioning the use of the approaches recommended in this guidance, the comments should be considered and an explanation provided for the selected approach. The policies set out in the Radionuclide PRG User Guide provide guidance to EPA staff. It also provides guidance to the public and regulated community on how EPA intends the National Oil and Hazardous Substances Pollution Contingency Plan (NCP) be implemented. EPA may change this guidance in the future, as appropriate. It should also be noted that calculating a PRG addresses neither human radionuclide dose or noncancer toxicity, nor potential ecological risk. Of the radionuclides generally found, at CERCLA sites, only uranium has potentially significant noncancer toxicity. When assessing sites with uranium as a contaminant, it may also be necessary to consider the noncancer toxicity of uranium, using other tools, such as EPA's Regional Screening Levels (RSLs) for Chemical Contaminants at Superfund Sites electronic calculator for uranium in soil, water, and air, and the WTC for uranium inside buildings. EPA's SPRG Calculator should be used to assess radionuclide cancer risk for hard outside surfaces, and the BPRG Calculator for radionuclide cancer risk inside buildings. EPA's DCC Calculator should be used to assess radionuclide dose for soil, water, and air, BDCC Calculator for radionuclide dose inside buildings, and the SDCC Calculator for radionuclide dose for hard outside surfaces. Similarly, some sites with radiological contaminants in sensitive ecological settings may also need to be evaluated for potential ecological risk. EPA's guidance "Ecological Risk Assessment Guidance for Superfund: Process for Designing and Conducting Ecological Risk Assessment" contains an eight step process for using benchmarks for ecological effects in the remedy selection process. This web calculator may be used to develop generic PRGs for radionuclides for several different exposure scenarios. The calculator is flexible and may be used to derive site-specific PRGs as more site characterization is obtained (EPA 2000a). Models reviewed by EPA in the Soil Screening Guidance for Radionuclides: Technical Background Document are presented in Section 3-2. This report provides a detailed technical analysis of five unsaturated zone fate and transport models for radionuclides. This report supports the information provided in Part 3 - Unsaturated Zone Models for Radionuclide Fate and Transport [PDF 383KB, 25 pages] of the Soil Guidance for Radionuclides: Technical Background Document on determining the general applicability of the models to subsurface conditions, and an assessment of each model's potential applicability to the soil screening process. A purpose of this guidance is to provide a PRG calculation tool to assist risk assessors, remedial project managers, and others involved with risk assessment and decision-making at CERCLA sites in developing PRGs. This database is based on Risk Assessment Guidance for Superfund: Volume I, Human Health Evaluation Manual (Part B, Development of Risk-based Preliminary Remediation Goals) (RAGS Part B). RAGS Part B provides guidance on calculating risk-based PRGs. Initially used at the scoping phase of a project using readily available information, risk-based PRGs may be modified based on site-specific data gathered during the RI/FS study. PRG development and screening should assist staff in streamlining the consideration of remedial alternatives. Chemical-specific PRGs are from two general sources. These are: (1) concentrations based on potential Applicable or Relevant and Appropriate Requirements (ARARs) and (2) risk-based concentrations. ARARs include concentration limits set by other environmental regulations such as Safe Drinking Water Act maximum contaminant levels (MCLs). The second source for PRGs, and the focus of this database tool, is risk-based calculations that set concentration limits using carcinogenic toxicity values under specific exposure conditions. The recommended approach for developing remediation goals is to identify PRGs at scoping, modify them as needed at the end of the RI or during the FS based on site-specific information from the baseline risk assessment, and ultimately select remediation levels in the Record of Decision (ROD). In order to set radionuclide-specific PRGs in a site-specific context, however, assessors must answer fundamental questions about the site. Information on the radionuclides that are present onsite, the specific contaminated media, land-use assumptions, and the exposure assumptions behind pathways of individual exposure is necessary in order to develop radionuclide-specific PRGs. The PRG calculator provides the ability to modify the standard default PRG exposure parameters to calculate site-specific PRGs. This database tool presents standardized risk-based PRGs and variable risk-based PRG calculation equations for radioactive contaminants. Ecological effects are not considered in the calculator for radionuclides PRGs. PRGs are presented for resident soil, outdoor worker soil, indoor worker soil, composite worker soil, recreator soil, farmer soil, construction worker soil, tap water, air, farm products and fish ingestion. The risk-based PRGs for radionuclides are based on the carcinogenicity of the contaminants. Cancer slope factors (SFs) used are provided by the Center for Radiation Protection Knowledge. The main report is Calculations of Slope Factors and Dose Coefficients and the tables of slope factors are in a separate appendix. Non-carcinogenic effects are not considered for radionuclide analytes, except for uranium for which both carcinogenic and non-carcinogenic effects are considered. To determine PRGs for the chemical toxicity of uranium, and for other chemicals, go to the Regional Screening Levels for Chemical Contaminants at Superfund Sites webpage. The standardized PRGs are based on default exposure parameters and incorporate exposure factors that present RME conditions. This database tool presents PRGs in both activity and mass units. Once this database tool is used to retrieve standard PRGs or calculate site-specific PRGs, it is important to clearly demonstrate the equations and exposure parameters used in the calculations. Discussion of the assumptions that go into the PRGs calculated should be included in the document where the PRGs are presented such as a Remedial Investigation (RI) Report or Feasibility Study. This website combines current Center for Radiation Protection Knowledge SFs with standard exposure factors to estimate contaminant concentrations in environmental media (biota, air, soil and water) that are protective of humans (including sensitive groups) over a lifetime. Sufficient knowledge about a given site may warrant the use of site-specific assumptions which may differ from the defaults. Exceeding a PRG usually suggests that further evaluation of the potential risks is appropriate. The PRG concentrations presented on this website can be used to screen pollutants in environmental media, trigger further investigation, and provide initial cleanup goals, if applicable. PRGs should be applied in accordance with guidance from EPA Regions. In addition to this guidance, for relevant training, see the internet-based course "Radiation Risk Assessment: Updates and Tools." PRGs are isotope concentrations that correspond to certain levels of risk from exposure to air, soil, water and biota. Slope Factors (SFs), for a given radionuclide represent the risk equivalent per unit intake (i.e. ingestion or inhalation) or external exposure of that radionuclide. In risk assessments these SFs are used in calculations with radionuclide concentrations and exposure assumptions to estimate risk from exposure to radioactive contamination. The calculations may be rearranged to generate PRGs for a specified level of risk. SFs may be specified for specific body organs or tissues of interest, or as a weighted sum of individual organ risk, termed the effective risk equivalent. These SFs may be multiplied by the total activity of each radionuclide inhaled or ingested per year, or the external exposure concentration to which a receptor may be exposed, to estimate the risk to the receptor. Slope Factors used are provided by the Center for Radiation Protection Knowledge. The main report is Calculations of Slope Factors and Dose Coefficients and the tables of DCFs are in a separate appendix. Inhalation slope factors are tabulated separately for each of the three lung absorption types considered in the lung model currently recommended by the International Commission on Radiological Protection (ICRP), and, where appropriate, for inhalation of radionuclides in vapor or gaseous forms. The designations "F", "M", and "S" presented in the Radionuclide Table under the heading "ICRP Lung Type" refer to the lung absorption type for inhaled particulate radionuclides, expressed as fast (F), medium (M), or slow (S), as used in the current ICRP model of the respiratory tract. The inhalation slope factor value tabulated in the Radionuclide Table for each radionuclide have been selected based on the following guidelines: (1) For those elements where Table 4.1 of Federal Guidance Report No. 13 (and Table 2 of ICRP Publication 72) specifies a recommended default lung absorption type for particulates, the inhalation slope factor for that type is tabulated in the Radionuclide Table for each radioisotope of that element. (2) For those elements where no specific lung absorption type is recommended and multiple types are indicated as plausible choices, the inhalation slope factor reported in the Radionuclide Table for each radioisotope of that element is the maximum of the values for each of the plausible lung absorption types. (3) Where Federal Guidance Report No. 13 specifies risk coefficients for multiple chemical forms of certain elements (tritium, carbon, sulfur, iodine, and mercury), the inhalation slope factor value for the form estimated to pose the maximum risk is reported in the Radionuclide Table in most cases. Inhaled particulates are assumed to have an activity median aerodynamic diameter (AMAD) of 1 um, as recommended by the ICRP for consideration of environmental exposures in the absence specific information physical characteristics of the aerosol. Where appropriate, radionuclides may be present in gas or vapor form, are designated by "G" and "V", respectively; such radionuclides include tritium, carbon, sulfur, nickel, ruthenium, iodine, tellurium, and mercury. The most common land uses and exposure assumptions are included in the equations on this website: Resident Soil, Composite Worker Soil, Outdoor Worker Soil, Indoor Worker Soil, Construction worker Soil, Farmer Soil, Recreator Soil, resident Air, Composite Worker Air, Outdoor Worker Air, Indoor Worker Air, Construction worker Air, Farmer Air, Recreator Air, Tapwater, Soil to Groundwater and Ingestion of Fish. The PRGs are generated with standard exposure route equations using EPA SFs and exposure parameters. For the calculation of soil ingestion slope factors, area correction factors, and gamma shielding factors, a standard soil density of 1.6 g/cm3 has been used. The calculator offers three options for calculating PRGs. Previous versions of this calculator employed slope factors that included progeny ingrowth for 100 years; designated "+D." The +D slope factors are no longer included in the pick list. This section describes the potential applications of the three choices and recommends a default PRG calculation. This is the preferred PRG calculation option and is marked as the default selection in the calculator. When a single isotope is selected, the calculator identifies all the daughters in the chain. The PRGs for each daughter are combined with the parent on a fractional basis. The fractional basis is determined by branching fractions where a progeny may decay into more than one isotope. The resulting PRG is now based on secular equilibrium of the full chain. For straight chain decay, all the progeny would be at the same activity of the parent and the PRG provided in the output would be the inverse sum of the reciprocal PRGs of the parent and all the progeny. Currently, all the soil PRG equation images are presented with a radioactive decay term to account for half-lives shorter than the exposure duration. Decay is not included in this PRG option as the assumption of secular equilibrium is that the parent is continually being renewed. When the secular equilibrium PRG output option is selected, the PRG Calculator now gives the option to show the individual progeny contributions for the PRG (and risk) output. When the option to display progeny contribution is selected, the PRG Calculator output gives the secular equilibrium PRG and the individual progeny PRGs in separate tables. This option displays the PRGs calculated with half-life decay as identified in the PRG equation images. In addition to the selected isotope, all the individual progeny PRGs are displayed. Each PRG is determined with each isotopes respective half-life and not that of its parent isotope. This option does not assume secular equilibrium and presents the progeny so that when screening environmental data against PRGs, the risk assessor can identify any isotopes for which he has no data. Users can alter progeny half-life to match the parent isotope or other progeny or to account for ingrowth and decay over a chain.
This option displays PRGs, with half-life decay as identified in the PRG equation images, for only the selected isotopes. In this output, secular equilibrium is not assumed and no progeny PRGs are displayed or contribution combined into the PRG for the selected isotope. EPA classifies all radionuclides as Group A carcinogens ("carcinogenic to humans"). Group A classification is used only when there is sufficient evidence from epidemiologic studies to support a causal association between exposure to the agents and cancer. The appendix radionuclide table, from the Center for Radiation Protection Knowledge, lists ingestion, inhalation and external exposure cancer slope factors (risk coefficients for total cancer morbidity) for radionuclides in conventional units of picocuries (pCi). Ingestion and inhalation slope factors are central estimates in a linear model of the age-averaged, lifetime attributable radiation cancer incidence (fatal and nonfatal cancer) risk per unit of activity inhaled or ingested, expressed as risk/pCi. External exposure slope factors are central estimates of lifetime attributable radiation cancer incidence risk for each year of exposure to external radiation from photon-emitting radionuclides distributed uniformly in a thick layer of soil, and are expressed as risk/yr per pCi/gram soil. External exposure slope factors can also be used which have units of risk/yr per pCi/cm2 soil. When combined with site-specific media concentration data and appropriate exposure assumptions, slope factors can be used to estimate lifetime cancer risks to members of the general population due to radionuclide exposures. EPA currently provides guidance on inhalation risk assessment in RAGS Part F (Risk Assessment Guidance for Superfund Volume I: Human Health Evaluation Manual (Part F, Supplemental Guidance for Inhalation Risk Assessment). This guidance only addresses chemicals. The development of inhalation slope factors for radionuclides differs from the guidance presented in RAGS Part F for development of inhalation unit risk (IUR) values for chemicals. The SFs from the Center for Radiation Protection Knowledge differ from the values presented in HEAST. The SFs were calculated using ORNL's DCAL software in the manner of Federal Guidance Report 12 and 13. For the calculation of soil ingestion slope factors, a standard soil density of 1.6 g/cm3 has been used. The radionuclides presented are those provided in the International Commission on Radiological Protection (ICRP) Publication 107. This document contains a revised database of nuclear decay data (energies and intensities of emitted radiations, physical half-lives and decay modes) for 1,252 naturally occurring and man-made radionuclides. ICRP Publication 107 supersedes the previous database, ICRP Publication 38 published in 1983.
Most dose and risk coefficients are presented for radionuclides in their ground state. In the decay process, the newly formed nucleus may be in an excited state and emit radiation; e.g., gamma rays, to lose the energy of the state. The excited nucleus is said to be in a metastable state which is denoted by the chemical symbol and atomic number appended by "m"; e.g., Ba-137m. If additional higher energy metastable states are present then "n", "p", ... is appended. Metastable states have different physical half-lives and emit different radiations and thus unique dose and risk coefficients. In decay data tabulations of ICRP 107), if the half-life of a metastable state was less than 1 minute then the radiations emitted in de-excitation are included with those of the parent radionuclide. Click to see a graphical representation of the decay of Cs-137 to Ba-137.
Eu-152, in addition to its ground state has two metastable states: Eu-152m and Eu-152n. The half-lives of Eu-152, Eu-152m and Eu-152n are: 13.5 y, 9.31 m and 96 m, respectively and the energy emitted per decay is 1.30 MeV, 0.080 MeV, and 0.14 MeV, respectively.
Several radionuclide-specific parameters are needed for development of the PRGs. The parameters are selected from a hierarchy of sources. Many sources are used to populate the database of radionuclide-specific parameters. They are briefly described below.
Generally the hierarchies below are followed.
There are 22 individually calculated PRGs that make up the default produce PRG. Each individual PRG is determine based on produce specific data such as intake rate, soil to plant transfer factors (Bvwet), and soil mass loading factor (MLF). These 22 individual PRGs are then summed by inverse reciprocal to determine a total produce PRG. The MLFs and intake rates used in the determination of the default biota PRGs are based on fresh weight. Intake rates, MLFs, and tranfer factors were updated in July 2016. A pdf of the Technical Memorandum, released for this update, can be found here. This file is engineered for 2 sided printing.
Table 2.4.1-A provides all of the default produce intake rates that are used to determine the total produce PRG. The delineation of (FW) in the column header indicates that the intake rates are for fresh weight, these are the intake rates used when the tool is run in default mode. In site-specific mode, the user may choose between Fresh Weight (FW) or Cooked Weight (CPW), which takes cooking and prepartion loss into account. In addition, the user may also add rice and cereal grain to the produce output. These intake rates can be found in Table 2.4.1-B below and are only given in dry weight (DW). In user-provided mode, the user may change produce specific and element specific parameters to model produce that is not provided in our tool, such as soil to plant transfer factor, mass loading factor, contaminated fraction, and intake rates. Another source for intake rates is the Food Commodity Intake Database (FCID). If the FCID is used, the user must convert the data to g/day, as it is required for use in this tool. In addition, a local food survey can be conducted. Much of the methodology in the Guidance for Conducting Fish and Wildlife Consumption Surveys may be useful for surveying produce consumption.
To determine which produce are commonly cultivated in the area around the site, users should contact their county extension office. The National Pesticide Information Center has an interactive map that allows users to choose their state and county; then connects them to their county extension office. The new soil to plant transfer factors (Bvwet) from IAEA (TRS-472) are unique to climate zone, soil type, and produce type. There are three climate zones (Temperate, Tropical, and Subtropical), seven soil types (Default, Sand, Loam, Clay, Organic, Coral Sand, and Other), and 24 produce types implemented in the PRG calculator. When the tool is run in default mode, the climate zone is temperate, the soil type is Default, which applies to all soil types, and 22 produce are used. Corn and rice are not used in default mode because the parameters used for these are based on dry weight whereas the other 22 produce are based on fresh weight. For rice, IAEA did not specify a particular climate zone and, therefore, the rice transfer factors have been applied to all three climate zones. The following map shows how the climate zones are distributed across the United States. *The Holdridge life zones of the conterminous United States in relation to ecosystem mapping. Journal of Biogeography, 26, 1032.
Table 2 below describes the soil classification used in TRS-472. The Coral Sand and Other soil types are not listed in Table 2. The 'Other' soil type classification, in a temperate climate, was created for soils without characterization data, and for mineral soils with unknown sand and clay contents (TRS-472 pg. 9). For tropical climates, the 'Coral Sand' soil type classification was changed from 'Other', given in TRS-472, because it refers to soils that are outside the classification scheme used here, such as Marshall Island soils, classified by the authors as coral sand soil (TRS-472 pg. 73). *Technical Report Series no. 472. *Land Data Assimilation Systems (LDAS). NASA
The following table illustrates which soil to plant transfer factor categories from IAEA are used for each produce type in the PRG calculator. The individual produce output only lists the category name from IAEA, however, a value from a secondary source may be being utilized. In default mode, the (FW) intake rates from Table 2.4.2-A are used. Similar to produce, there is an option to select Cooked Weight in site-specific mode. The intake rates for poultry include chicken, turkey, and duck. In default mode, the parameters used for poultry and eggs are for chicken specifically (i.e. Qp etc.). If eggs and poultry is selected in site specific mode, the user will have the option to switch between chicken, turkey, duck, and goose which will change the previously mentioned respective parameters, however the transfer factor used will still be meant for chicken or duck per TRS-472. If the user has a specific tranfer factor for turkey or goose, then user-provided mode should be used. Site-specific mode will also offer the user the option to add animal products from Table 2.4.2-B to the output. The tool has transfer factors for these products, however, the user will need to enter their own intake rate data as the tool does not provide any. Again, the Food Commodity Intake Database (FCID) may be used to find intake rate data but the user must convert the data to g/day, as it is required for use in this tool. A mass loading factor (MLF) is the amount, or mass, of soil that adheres to the plant surface. The following table lists the MLFs used in this tool according to plant type. For more information on how these were derived please see the Technical Memorandum: Biota Modeling in EPA's Preliminary Remediation Goal and Dose Compliance Concentration Calculators for Use in EPA Superfund Risk Assessment: Explanation of Intake Rate Derivation, Transfer Factor Compilation, and Mass Loading Factor Sources. This file is engineered for 2 sided printing. The value of 5.5 given in Table D.3 of the RESRAD User's Manual for carbon root uptake was derived from data in Ng et al 1968. Table 4 of Ng 1968 presents a carbon composition in typical agricultural soil of 2.00E+04 ppm and a carbon composition in terrestrial plants of 1.10E+05 ppm in Table 10A. 1.10E+05 divided by 2.00E+004 gives the value of 5.5 reported in RESRAD. This value assumes that all the carbon in the plant is taken up by the roots; however, this is not the case. Photosynthesis is the primary source of carbon in plants. Carbon may be present in gas form in soils and volatilize into the plant canopy where it may be taken up by the plant in some fraction depending on atmospheric conditions. It is typically estimated 2% of plant carbon comes from soil (either directly or by uptake from the sub-canopy atmosphere). The other 98% of plant carbon comes from the above-canopy atmosphere, which is assumed not to contain carbon from the contaminated site. Consider that a plant is about 90% water and of the 10% dry matter about 40% is carbon. Therefore, plants comprise about 4% carbon on a fresh weight basis. A mineral soil is typically about 2% to 5% organic matter, which corresponds to 0.8% to 2% carbon on a dry mass basis. Thus, taking the ratio of carbon contents results in a transfer factor of 4%/(0.8% to 2%) = 5.0 to 2.0 g fresh plant/g dry soil. The next step is to apply the 2% fraction of plant carbon derived from soil. The resulting range of transfer factors is 0.1 to 0.04; (2%*(5.0 to 2.0)). The value of 0.1 is chosen for the calculation of PRGs and is used for all the BVwet values. BVdry values are derived for each plant type based on individual moisture content. For comparison purposes, the 5.5 value from RESRAD gives a transfer factor of 0.11 if the 2% assumption is made. The above derivation assumes that all the carbon taken up by the plant is radioactive. In situations where radioactive carbon is mixing with stable carbon, a site-specific transfer factor can be derived using a model called, "specific activity". Essentially, specific activity is the concentration ratio of the radioactive form to the stable form of carbon. Specific activity assumes, that within a compartment (i.e. soil), the radioactive contaminant mixes with the stable form both chemically and physically. Plants uptake the element in the same ratio as it exists in the soil compartment, resulting in the same ratio in the plant as in the soil compartment. To determine a site-specific soil to plant transfer factor, actual site data must be available. Further, the flux rate of the element must be in a steady-state condition. The environmental compartments must be well defined and the fluxes between compartments well understood. For further information, refer to the following: AMEC/004041/007 section 5, ANL/EAD-4 Appendix L, and IAEA TECDOC 1616 page 550. This PRG calculator focuses on the application of generic and simple site-specific approaches that are part of a larger framework for calculating concentration levels for complying with risk-based criteria. Generic PRGs for a 1 × 10⁻⁶ cancer risk standard are provided by viewing either the tables in the PRG Download Area section of this calculator or by running the PRG Calculator section of this website with the "Defaults" option. Part 3 of the Soil Screening Guidance for Radionuclides: Technical Background Document provides more information about 5 more detailed soil to groundwater models that are part of the same framework. Generic PRGs are calculated from the same equations presented in the site-specific portion of the calculator, but are based on a number of default assumptions chosen to be protective of human health for most site conditions. Generic PRGs can be used in place of site-specific PRG levels; however, in general, they are expected to be more conservative than site-specific levels. The site manager should weigh the cost of collecting the data necessary to develop site-specific PRGs with the potential for deriving a higher PRG that provides an appropriate level of protection. The framework presented in Part 3 of the Soil Screening Guidance for Radionuclides: Technical Background Document includes more detailed modeling approaches that take into account more complex site conditions than the generic or simple site-specific methodology used for the soil to groundwater scenario in this calculator. More detailed approaches may be appropriate when site conditions (e.g., very deep water table, very thick uncontaminated unsaturated zone, soils underlain by karst or fractured rock aquifers) are substantially different than those assumed in the generic or simple-site methodology presented in this calculator. Further information on using more detailed approaches may be found in "Simulating Radionuclide Fate and Transport in the Unsaturated Zone: Evaluation and Sensitivity Analyses of Select Computer Models". This report provides a detailed technical analysis of five unsaturated zone fate and transport models for radionuclides. To avoid unnecessary inconsistency between radiological and chemical risk assessment and radiological dose assessment at the same site, users should generally use the same model for chemical and radionuclide risk assessment and radionuclide dose assessment. If there is a reason on a site-specific basis for using another model justification for doing so should be developed. The justification should include specific supporting data and information in the administrative record. The justification normally would include the model runs using both the recommended EPA PRG model and the alternative model. Users are cautioned that they should have a thorough understanding of both the PRG recommended model and any alternative model when evaluating whether a different approach is appropriate. When alternative models are used, the user should adjust the default input parameters to be as close as possible to the PRG inputs, which may be difficult since models tend to use different definitions for parameters. Numerous computerized mathematical models have been developed by EPA and other organizations to predict the fate and transport of radionuclides in the environment; these models include single-media unsaturated zone models (for example, groundwater transport) as well as multi-media models. These models have been designed for a variety of goals, objectives, and applications; as such, no single model may be appropriate for all site-specific conditions. Generally, even when a different model is used to predict fate and transport of radionuclides through different media, EPA recommends using the PRG calculators for the remedial program to establish the risk-based concentrations to ensure consistency with CERCLA, the NCP and EPA's Superfund guidance for remedial sites. Prior to using another model for risk assessment at a CERCLA remedial site, EPA regional staff, should consult with the Superfund remedial program's National Radiation Expert (Stuart Walker, at (703) 603-8748 or walker.stuart@epa.gov. For more information on issue, please see questions 10 and 16 on pages 12 and 17 to 18 of Radiation Risk Assessment At CERCLA Sites: Q & A (EPA 540-R-012-13, May 2014). The PRG calculator provides an option to select risk output. In the calculator, select yes if risk output is desired. Selecting risk output requires the calculator to be run in "Site Specific" mode. The "Soil to Groundwater" medium does not have risk output and the risk option will become disabled when selected. The risk values presented on this site are radionuclide-specific values for individual contaminants in air, water, soil and biota that may warrant further investigation or site cleanup.
This portion of the risk assessment process is generally referred to as "Risk Characterization". This step incorporates the outcome of the exposure and toxicity assessments to calculate the risk resulting from potential exposure to radionuclides via the pathways and routes of exposure determined appropriate for the source area. The process used to calculate risk in this calculator does not follow the traditional method of first calculating a CDI (Chronic Daily Intake). Rather, risk is derived using a simple method that relies on the linear nature of the relationship between concentration and risk. Using the equation below, a PRG, the target risk used to calculate the PRG, and a concentration entered by the user are all that is required to calculate risk. TR / PRG = Risk / C The linear equation above is then rearranged to solve for risk: Risk = (C × TR) / PRG
As presented in the previous section, the risk output is dependent on the PRG calculated. Section 2.2 discusses the PRG output options. To summarize section 2.2, the PRG options are either secular equilibrium or not. If the data is collected from a site where secular equilibrium is assumed to be present, the user need only enter the activity of the parent in the calculator and a representative risk of the parent and all progeny will be presented in the calculator output. In the case of non-secular equilibrium the current "state of the chain" may not be known or easily calculated. In the case of relatively fast decaying isotopes, significant decay or ingrowth of progeny may have occurred since the sample date. Further, determining future activity of the contaminants may be useful in planning for future release of a property. A Decay Chain Activity Projection Tool has been developed where the user can select an isotope, enter a length of time to allow decay and ingrowth, and enter the beginning activity of the parent. The results of this tool, pictured below, are the activities of the parent and progeny at the end of the decay and ingrowth of progeny time. These activities can be entered into the PRG calculator to calculate risk using the second and third PRG Output options. The linear risk equation, listed above, are valid only at low risk levels (below estimated risks of 0.01). For sites where radiological exposure might be high (estimated risks above 0.01, an alternate calculation should be used. The one-hit equation, which is consistent with the linear low-dose model, should be used instead (RAGS, part A, ch. 8). The results presented on the PRG use this rule. In the following instances, the one-hit rule is used independently in the risk output tables:
The tables in the PRG Download Area provide generic concentrations in the absence of site-specific exposure assessments. Screening concentrations can be used for: When using PRGs, the exposure pathways of concern and site conditions should match those taken into account by the screening levels. (Note, however, that future uses may not match current uses. Future uses of a site should be logical as conditions which might occur at the site in the future.) Thus, it is necessary to develop a conceptual site model (CSM) to identify likely contaminant source areas, exposure pathways, and potential receptors. This information can be used to determine the applicability of screening levels at the site and the need for additional information. The final CSM diagram represents linkages among contaminant sources, release mechanisms, exposure pathways, and routes and receptors based on historical information. It summarizes the understanding of the contamination problem. A separate CSM for ecological receptors can be useful. Part 2 and Attachment A of the Soil Screening Guidance for Radionuclides: Users Guide (EPA 2000a) contains the steps for developing a CSM. A conceptual site model for the land uses presented in this calculator is presented below. As a final check, the CSM should answer the following questions: The PRGs may need to be adjusted to reflect the answers to these questions. Natural background radiation should be considered prior to applying PRGs as cleanup levels. Background and site-related levels of radiation will be addressed as they are for other contaminants at CERCLA sites, for further information see EPA's guidance "Role of Background in the CERCLA Cleanup Program", April 2002, (OSWER 9285.6-07P). It should be noted that certain ARARs specifically address how to factor background into cleanup levels. For example, some radiation ARAR levels are established as increments above background concentrations. In these circumstances, background should be addressed in the manner prescribed by the ARAR. As with any risk-based tool, the potential exists for misapplication. In most cases, this results from not understanding the intended use of the PRGs. In order to prevent misuse of the PRGs, the following should be avoided: The PRGs consider human exposure to contaminated air, soils, water and biota. The equations and technical discussion are aimed at developing compliance levels for risk-based PRGs. The following text presents the land use equations and their exposure routes. Table 1 (at the end of the User's Guide) presents the definitions of the variables and their default values. The default values and exposure models are consistent with the Regional Screening Levels for Chemical Contaminants at Superfund Sites (RSL) calculator where the same pathways are addressed (e.g., ingestion and inhalation) and are analogous where pathways are similar (e.g., dermal and external exposure). This 2011 Exposure Factors Handbook. Any alternative values or assumptions used in remedy evaluation or selection on a CERCLA site should be presented with supporting rationale in Administrative Records. The PRG equations have evolved over time and are a combination of the following guidance documents:
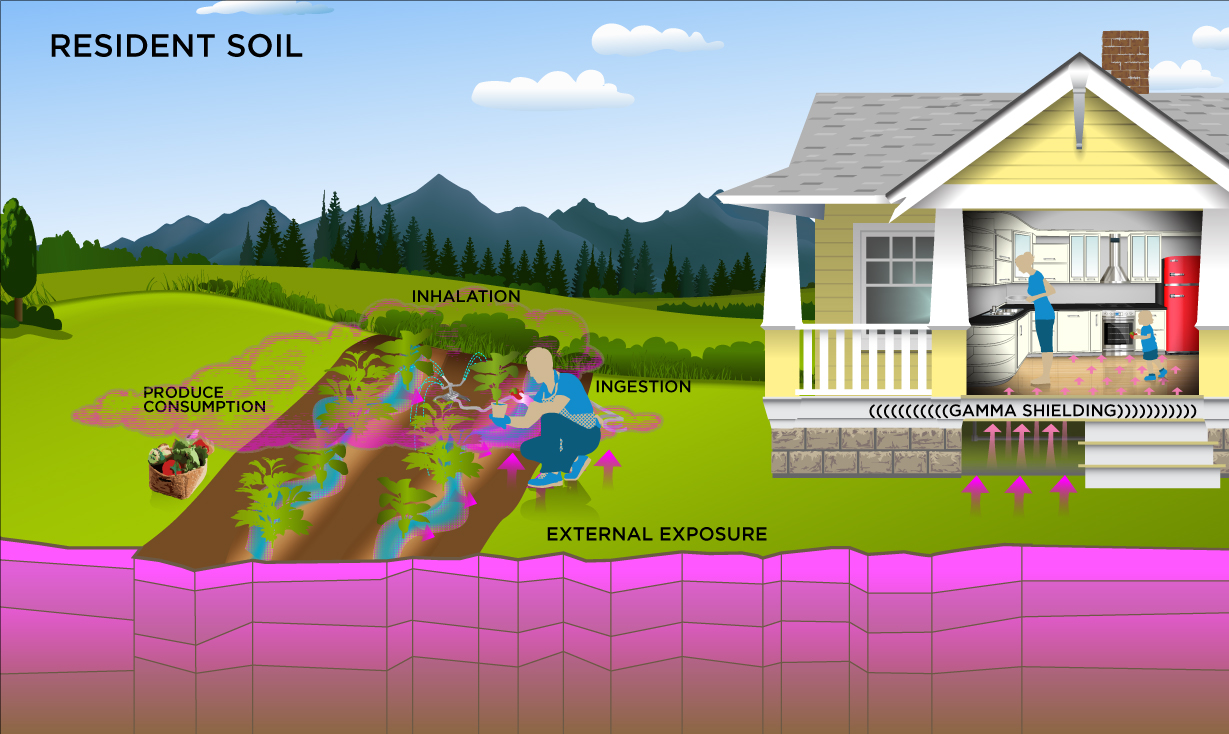
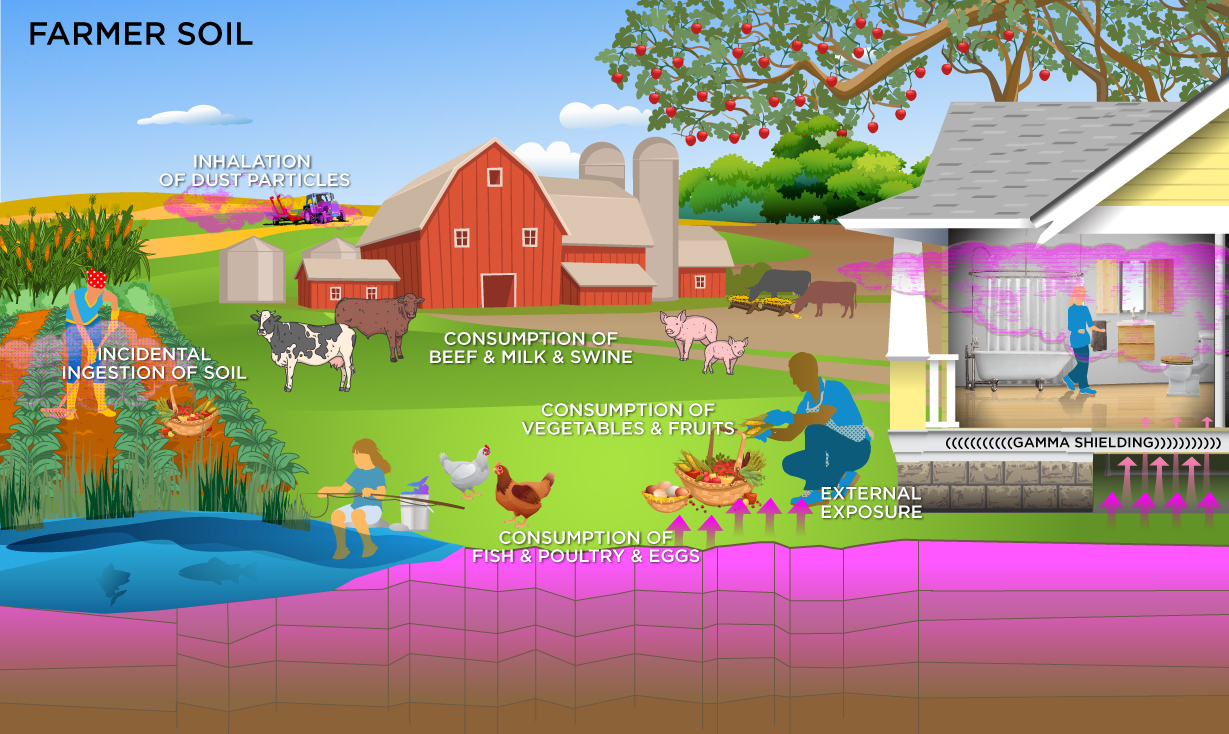
Users should note that if a route of exposure (e.g., ingesting fish from the pond in the farmer soil exposure scenario) is considered to be unreasonable at their site, both currently and in the future, they may eliminate the route in the site-specific option by entering zero for the ingestion rate of that route (e.g., replacing default fish ingestion rates in farmer soil scenario of 156.6 and 32.8 g/day with 0.0). This receptor spends most, if not all, of the day at home except for the hours spent at work. The activities for this receptor involve typical home making chores (cooking, cleaning and laundering) as well as gardening. The resident is assumed to be exposed to contaminants via the following pathways: incidental ingestion of soil, external radiation from contaminants in soil, inhalation of fugitive dust and consumption of home grown produce (100% of fruit and vegetables). Adults and children exhibit different ingestion rates for soil and produce. For example the child resident is assumed to ingest 200 mg per day while the adult ingests 100 mg per day. To take into account the different intake rate for children and adults, age adjusted intake equations were developed to account for changes in intake as the receptor ages. The resident soil land use equation, presented here, contains the following exposure routes: The consumption of produce exposure route drives the PRGs lower than all the other routes. It is recommended that produce-specific transfer factors (Bvwet) be used when available for a site. Further, the default transfer factors (Bvwet) from IAEA, used in these PRG calculations, are based on a composite of all soil groups. Transfer factors (Bvwet) for sand, loam, clay, organic, coral sand, and other soil types that may be more suited to a particular site are also provided. The site-specific option of the calculator can be used to focus on ingestion of individual produce types. When "Site-specific" is selected, if the user changes the "Select Isotope Info Type" to "User-provided", then a specific transfer factor may be changed.
where:
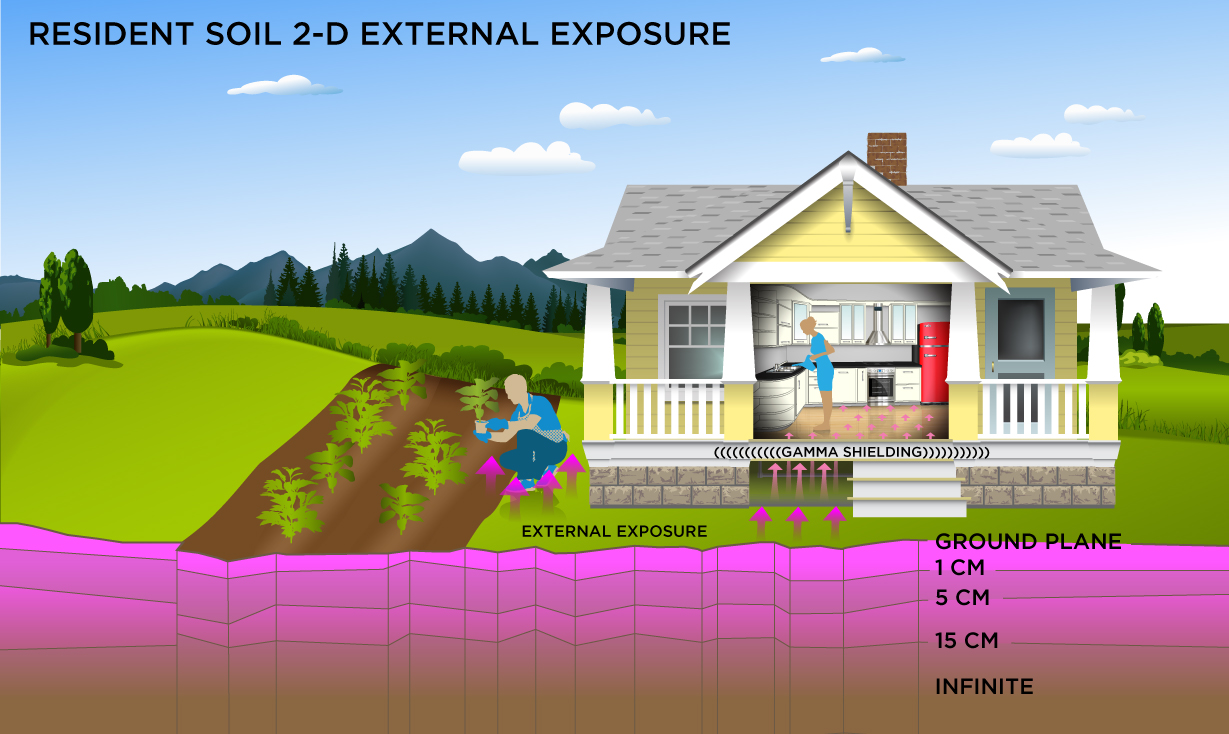
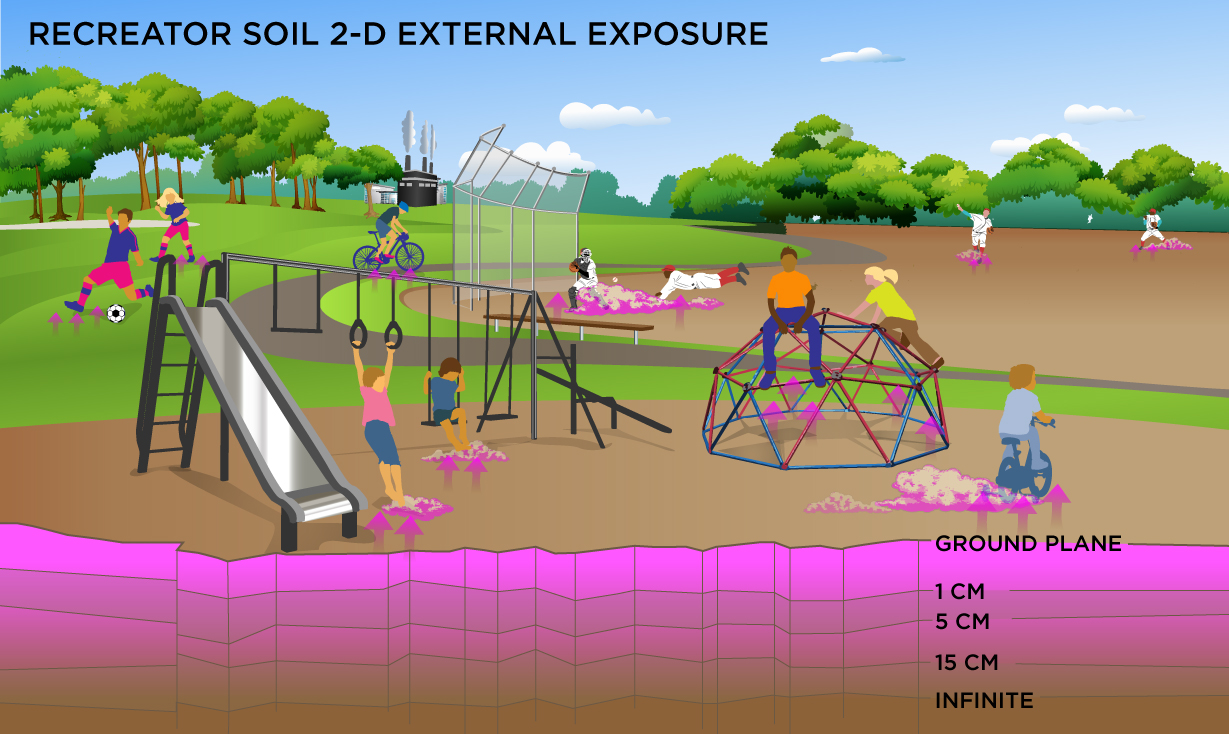
A number of studies have shown that inadvertent ingestion of soil is common among children 6 years old and younger (Calabrese et al. 1989, Davis et al. 1990, Van Wijnen et al. 1990). Therefore, the dose method uses an age-adjusted soil ingestion factor that takes into account the difference in daily soil ingestion rates, body weights, and exposure duration for children from 1 to 6 years old and others from 7 to 26 years old. The equation is presented below. This health-protective approach is chosen to take into account the higher daily rates of soil ingestion in children as well as the longer duration of exposure that is anticipated for a long-term resident. For more on this method, see RAGS Part B. Age adjusted intake factors are also used for inhalation of particulates emitted from soil, and consumption of produce. These equations are also presented in the above equations. Definitions of the input variables are in Table 1. This receptor spends most, if not all, of the day at home except for the hours spent at work. The activities for this receptor involve typical home making chores (cooking, cleaning and laundering) as well as gardening. This analysis is designed to look at external exposure from contamination of different area sizes. Areas considered are 1 to 1,000,000 square meters. Isotope-specific area correction factor (ACF) were developed for this analysis.
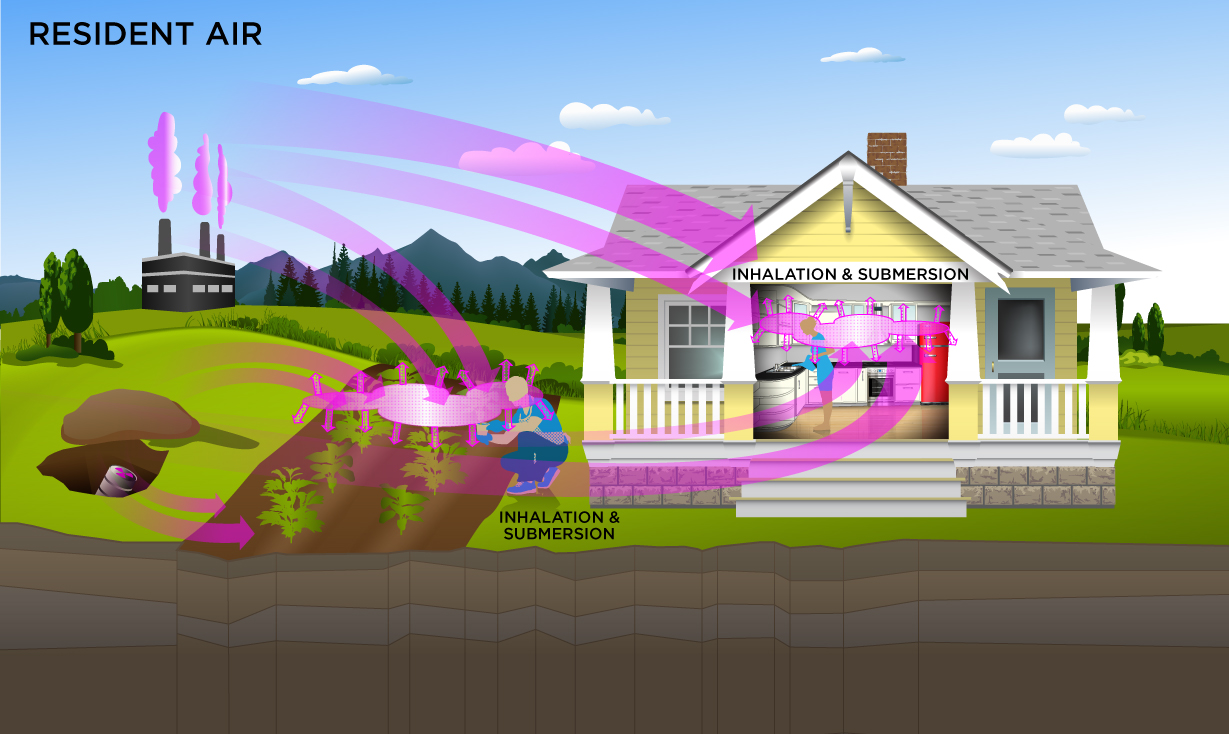
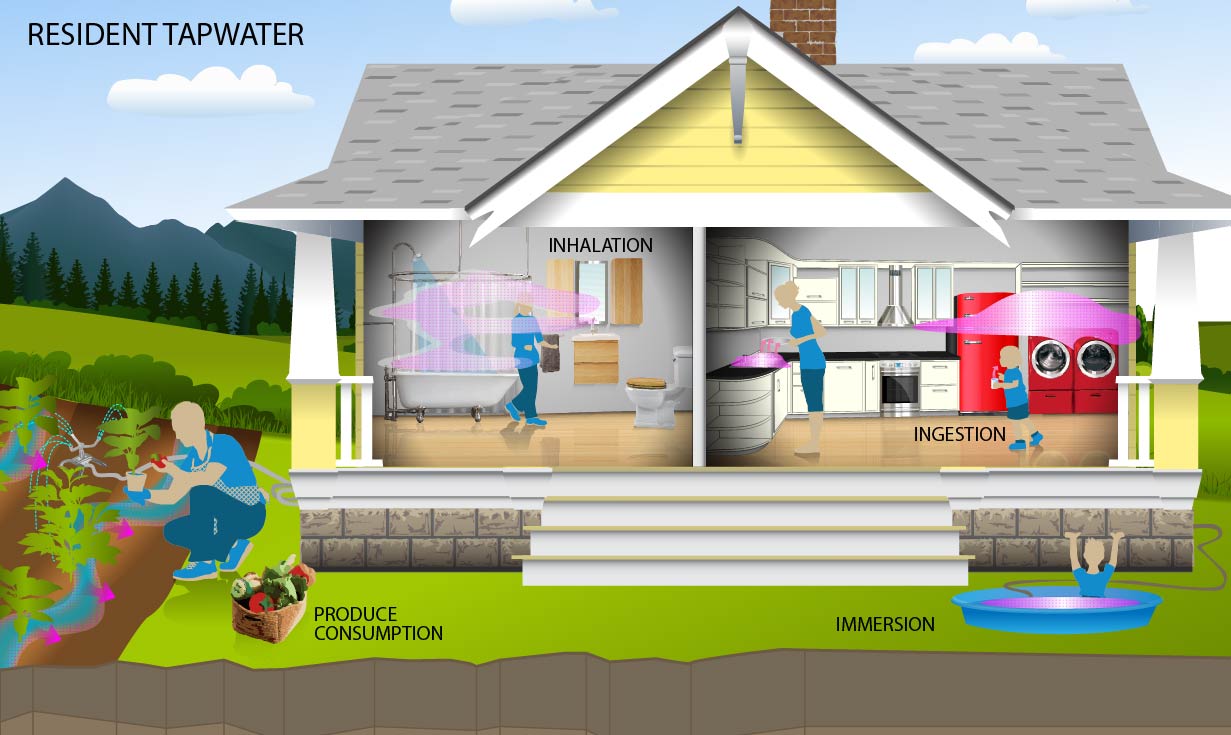
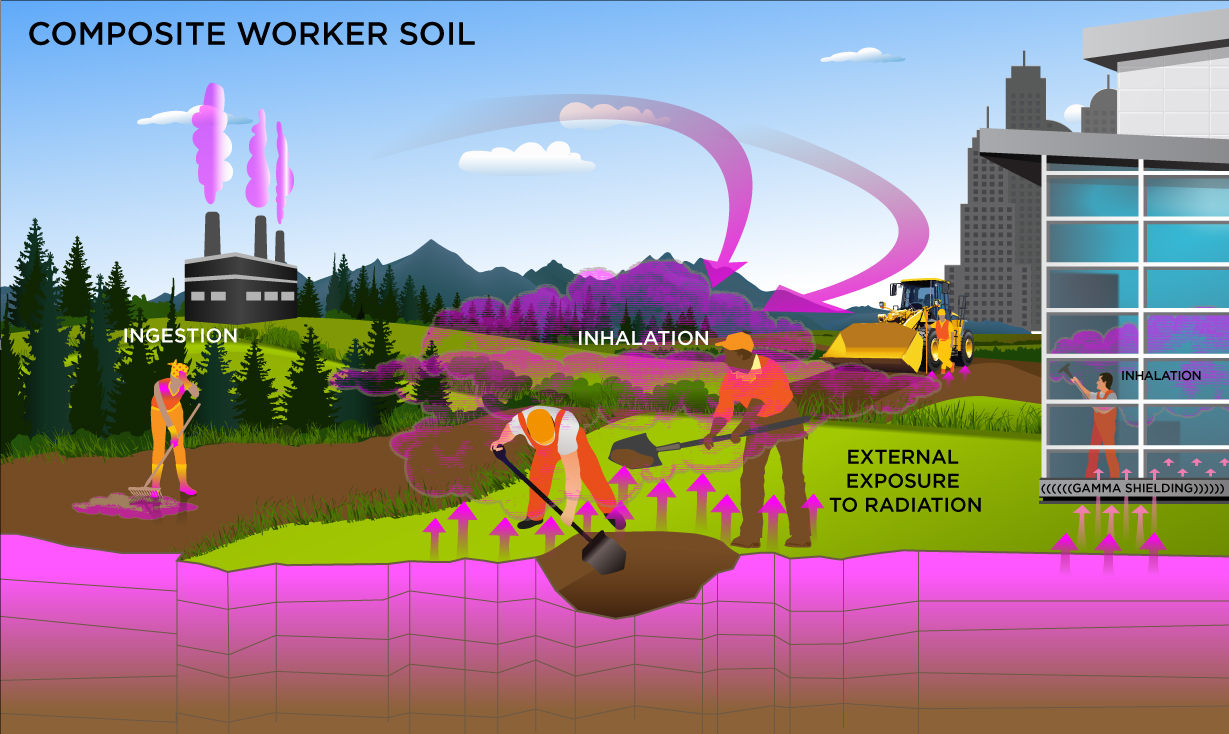
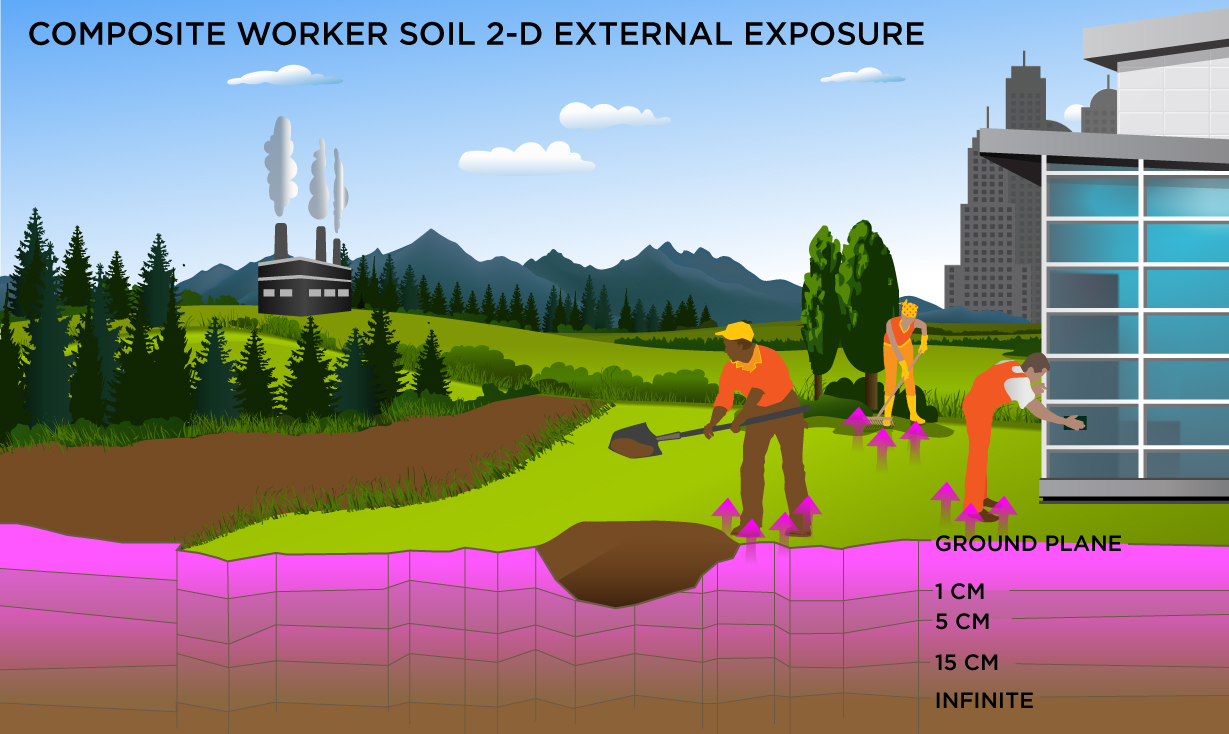
The resulting units for this recommended PRG are in pCi/g. The units are based on mass because the SF used is the soil volume for external exposure. The resulting units for this recommended PRG are in pCi/g. The units are based on mass because the SF used is the 1cm soil volume for external exposure. The resulting units for this recommended PRG are in pCi/g. The units are based on mass because the SF used is the 5cm soil volume for external exposure. The resulting units for this recommended PRG are in pCi/g. The units are based on mass because the SF used is the 15cm soil volume for external exposure. The resulting units for this recommended PRG are in pCi/cm2. The units are based on area because the SF used is the ground plane for external exposure. Definitions of the input variables are in Table 1. This receptor spends most, if not all, of the day at home except for the hours spent at work. The activities for this receptor involve typical home making chores (cooking, cleaning and laundering) as well as gardening. The resident is assumed to be exposed to contaminants via the following pathways: inhalation of ambient air and external radiation from contaminants in ambient air. To take into account the different inhalation rates for children and adults, age-adjusted intake equations were developed to account for changes in intake as the receptor ages. Two ambient air exposure conditions are offered for this scenario. The first scenario includes a half-life decay function and the second scenario does not. In situations where the contaminant in the air is not being replenished (e.g., an accidental one-time air release from a factory), equations for the first scenario should be used. In situations where the contaminant in the air has a continual source (e.g., indoor radon from radium in the soil, or an operating factory or landfill cap), equations for the second scenario should be used. The resident ambient air land use equation, presented here, contains the following exposure routes with half-life decay: The resident ambient air land use equation, presented here, contains the following exposure routes without half-life decay: Definitions of the input variables are in Table 1. This receptor is exposed to radionuclides that are delivered into a residence. Ingestion of drinking water is an appropriate pathway for all radionuclides. Activities such as showering, laundering, and dish washing also contribute to inhalation. The inhalation exposure route is only calculated for C-14, H-3, Ra-224, Ra-226, Rn-220, and Rn-222 which volatilize. External exposure to immersion in tapwater and exposure to produce irrigated with contaminated tapwater are also considered. The tapwater land use equation, presented here, contains the following exposure routes: Definitions of the input variables are in Table 1. This is a long-term receptor exposed during the work day who is a full time employee working on-site and who spends most of the workday conducting maintenance activities outdoors. The activities for this receptor (e.g., moderate digging, landscaping) typically involve on-site exposures to surface soils. The composite worker is expected to have an elevated soil ingestion rate (100 mg per day) and is assumed to be exposed to contaminants via the following pathways: incidental ingestion of soil, external radiation from contaminants in soil, inhalation of fugitive dust . The composite worker combines the most protective exposure assumptions of the outdoor and indoor workers. The only difference between the outdoor worker and the composite worker is that the composite worker uses the more protective exposure frequency of 250 days/year from the indoor worker scenario. This land use is for developing industrial default screening levels that are presented in the Download Area.
This is a long-term receptor exposed during the work day who is a full time employee working on-site and who spends most of the workday conducting maintenance activities outdoors. The activities for this receptor (e.g., moderate digging, landscaping) typically involve on-site exposures to surface soils. This analysis is designed to look at external exposure from contamination of different area sizes. Areas considered are 1 to 1,000,000 square meters. Isotope-specific area correction factor (ACF) were developed for this analysis.
The resulting units for this recommended PRG are in pCi/g. The units are based on mass because the SF used is the soil volume for external exposure.
The resulting units for this recommended PRG are in pCi/g. The units are based on mass because the SF used is the 1cm soil volume for external exposure.
The resulting units for this recommended PRG are in pCi/g. The units are based on mass because the SF used is the 5cm soil volume for external exposure.
The resulting units for this recommended PRG are in pCi/g. The units are based on mass because the SF used is the 15cm soil volume for external exposure.
The resulting units for this recommended PRG are in pCi/cm2. The units are based on area because the SF used is the ground plane for external exposure.
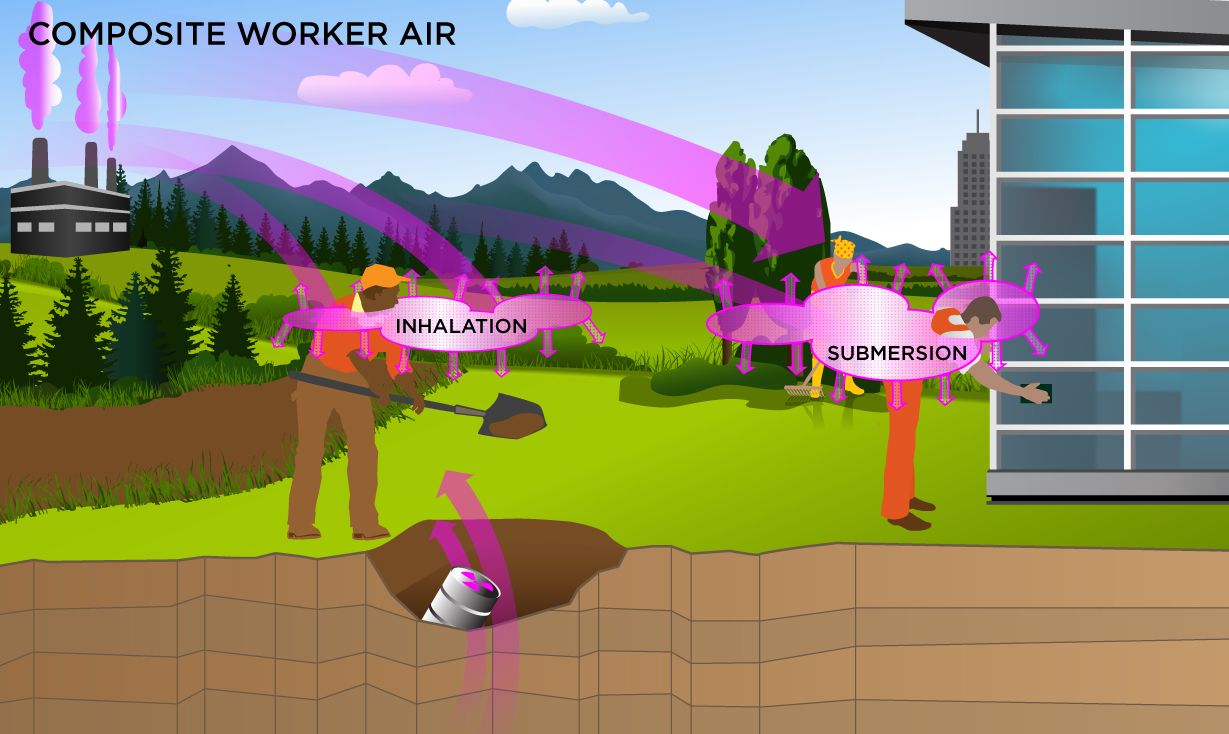
Definitions of the input variables are in Table 1. This is a long-term receptor exposed during the work day who is a full time employee working on-site and who spends most of the workday conducting maintenance activities outdoors. The activities for this receptor (e.g., moderate digging, landscaping) typically involve on-site exposures to surface soils. The composite worker is assumed to be exposed to contaminants via the following pathways: inhalation of ambient air and external radiation from contaminants in ambient air. The composite worker combines the most protective exposure assumptions of the outdoor and indoor workers. The only difference between the outdoor worker and the composite worker is that the composite worker uses the more protective exposure frequency of 250 days/year from the indoor worker scenario. Two ambient air exposure conditions are offered for this scenario. The first scenario includes a half-life decay function and the second scenario does not. In situations where the contaminant in the air is not being replenished (e.g., an accidental one-time air release from a factory), equations for the first scenario should be used. In situations where the contaminant in the air has a continual source (e.g., indoor radon from radium in the soil, or an operating factory or landfill cap), equations for the second scenario should be used. The composite worker ambient air land use equations, presented here, contain the following exposure routes with half-life decay:
The composite worker ambient air land use equation, presented here, contains the following exposure routes without half-life decay:
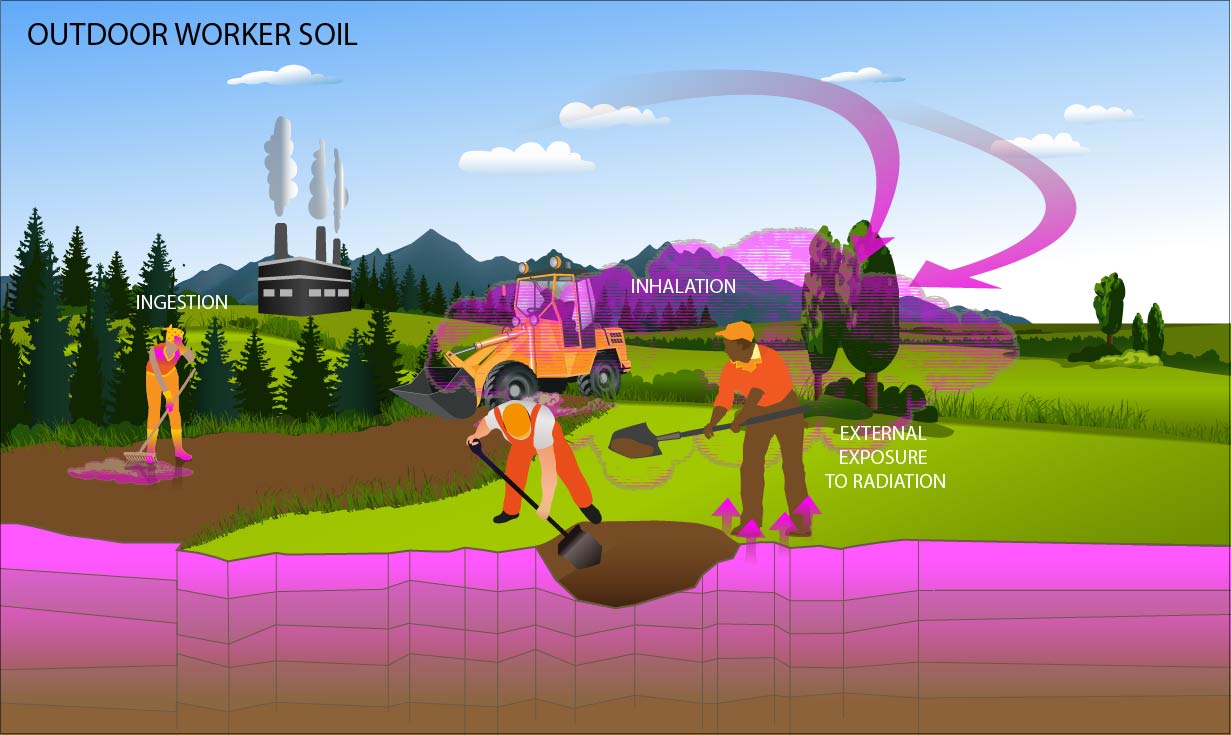
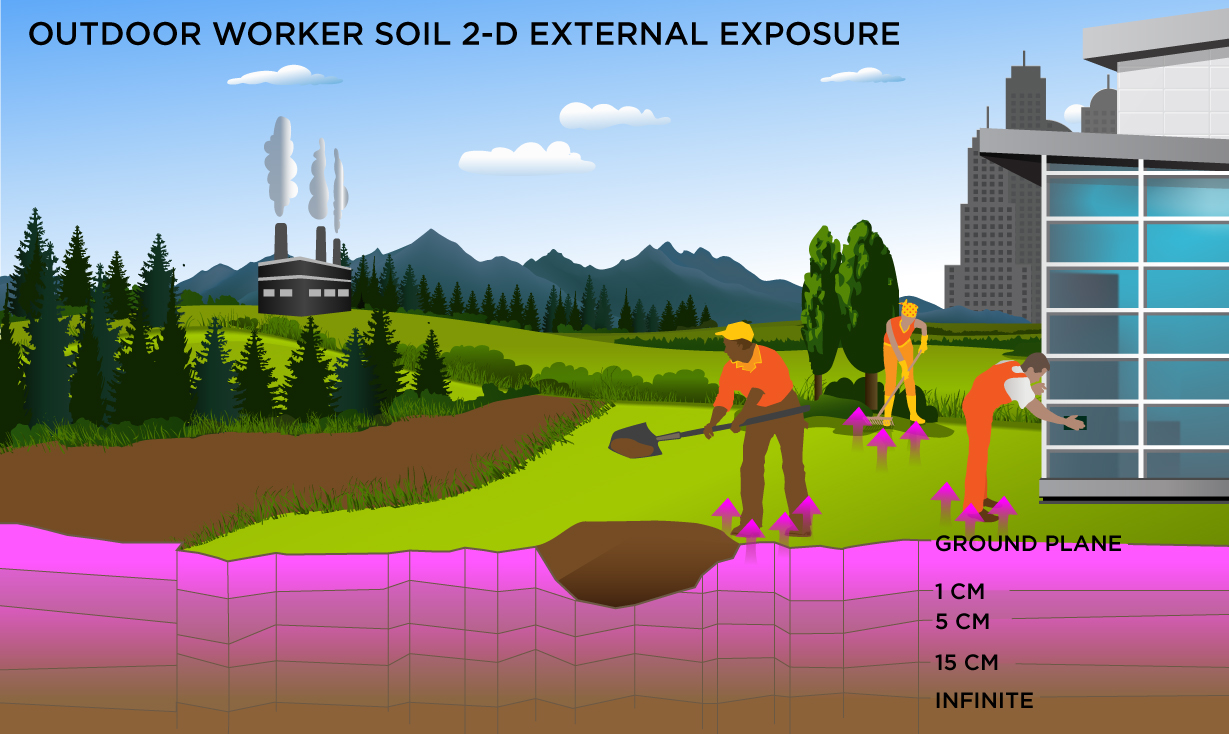
Definitions of the input variables are in Table 1. This is a long-term receptor exposed during the work day who is a full time employee working on-site and who spends most of the workday conducting maintenance activities outdoors. The activities for this receptor (e.g., moderate digging, landscaping) typically involve on-site exposures to surface soils. The outdoor worker is expected to have an elevated soil ingestion rate (100 mg per day) and is assumed to be exposed to contaminants via the following pathways: incidental ingestion of soil, external radiation from contaminants in soil, inhalation of fugitive dust. The outdoor worker receives more exposure than the indoor worker under commercial/industrial conditions. The outdoor worker soil land use is not provided in the Download Area but PRGs can be created by using the Calculator to modify the exposure parameters for the composite worker to match the equations that follow.
This is a long-term receptor exposed during the work day who is a full time employee working on-site and who spends most of the workday conducting maintenance activities outdoors. The activities for this receptor (e.g., moderate digging, landscaping) typically involve on-site exposures to surface soils. This analysis is designed to look at external exposure from contamination of different area sizes. Areas considered are 1 to 1,000,000 square meters. Isotope-specific area correction factor (ACF) were developed for this analysis.
The resulting units for this recommended PRG are in pCi/g. The units are based on mass because the SF used is the soil volume for external exposure.
The resulting units for this recommended PRG are in pCi/g. The units are based on mass because the SF used is the 1cm soil volume for external exposure.
The resulting units for this recommended PRG are in pCi/g. The units are based on mass because the SF used is the 5cm soil volume for external exposure.
The resulting units for this recommended PRG are in pCi/g. The units are based on mass because the SF used is the 15cm soil volume for external exposure.
The resulting units for this recommended PRG are in pCi/cm2. The units are based on area because the SF used is the ground plane for external exposure.
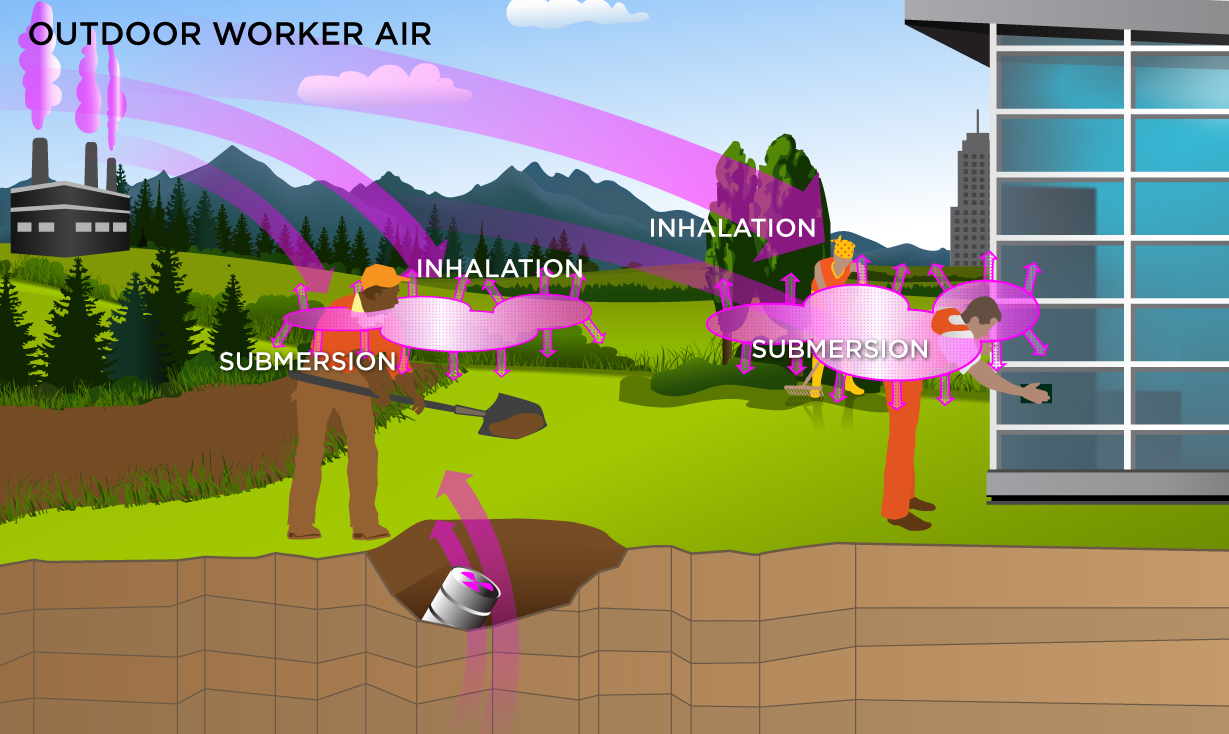
Definitions of the input variables are in Table 1. This is a long-term receptor exposed during the work day who is a full time employee working on-site and who spends most of the workday conducting maintenance activities outdoors. The activities for this receptor (e.g., moderate digging, landscaping) typically involve on-site exposures to surface soils. The outdoor worker is assumed to be exposed to contaminants via the following pathways: inhalation of ambient air and external radiation from contaminants in ambient air. Two ambient air exposure conditions are offered for this scenario. The first scenario includes a half-life decay function and the second scenario does not. In situations where the contaminant in the air is not being replenished (e.g., an accidental one-time air release from a factory), equations for the first scenario should be used. In situations where the contaminant in the air has a continual source (e.g., indoor radon from radium in the soil, or an operating factory or landfill cap), equations for the second scenario should be used. The outdoor worker ambient air land use equation, presented here, contains the following exposure routes with half-life decay:
The outdoor worker ambient air land use equation, presented here, contains the following exposure routes without half-life decay:
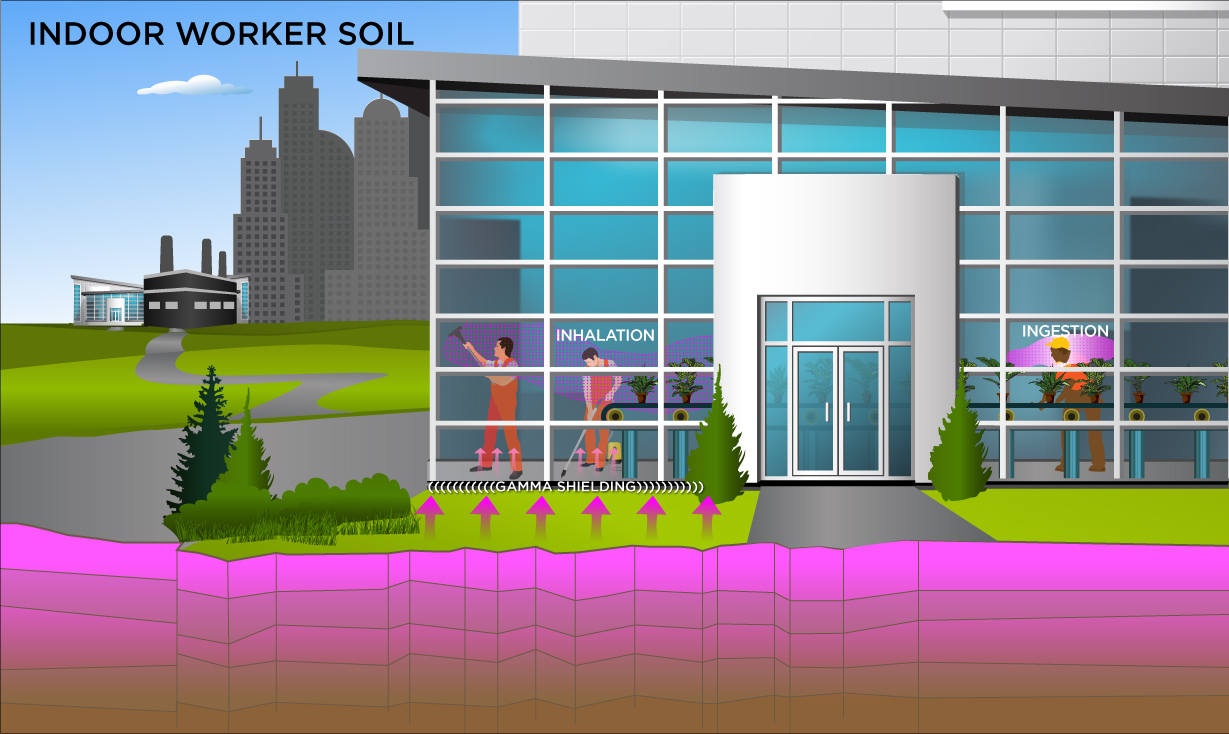
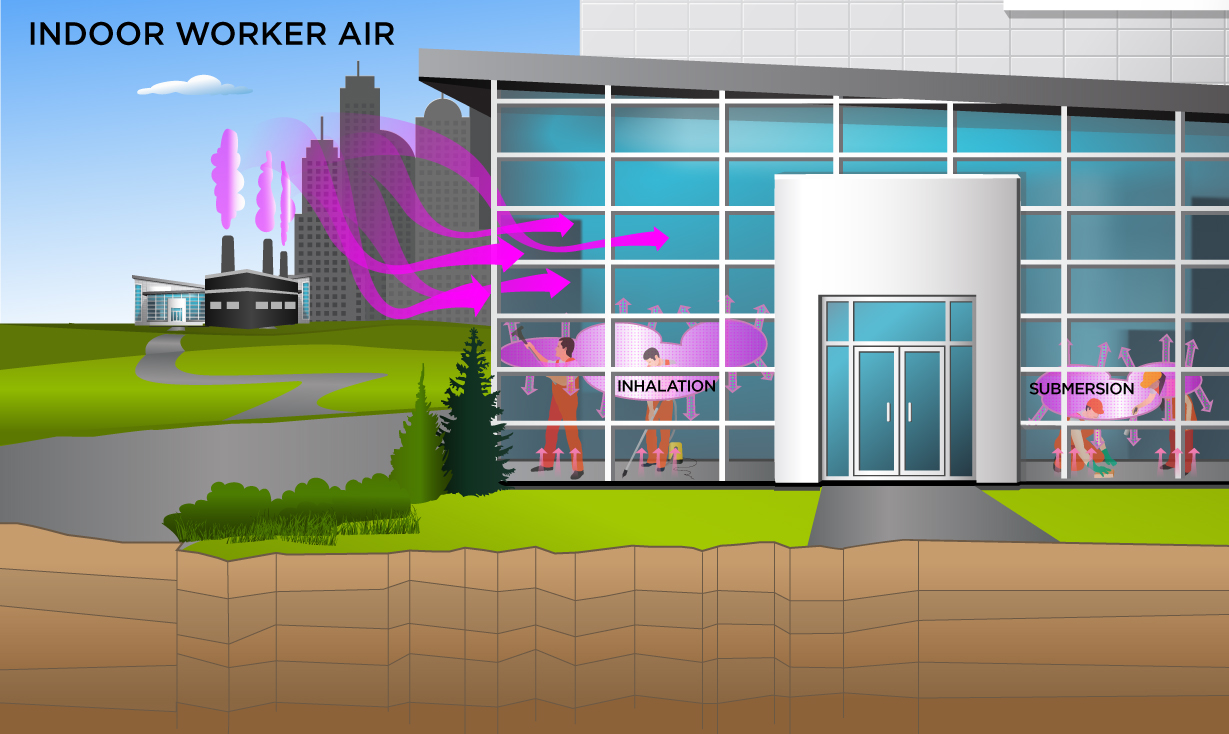
Definitions of the input variables are in Table 1. This receptor spends most, if not all, of the workday indoors. Thus, an indoor worker has no direct contact with outdoor soils. This worker may, however, be exposed to contaminants through ingestion of contaminated soils that have been incorporated into indoor dust, external radiation from contaminants in soil, and the inhalation of contaminants present in indoor air. PRGs calculated for this receptor are expected to be protective of both workers engaged in low intensity activities such as office work and those engaged in more strenuous activity (e.g., factory or warehouse workers). The indoor worker soil land use is not provided in the Download Area but PRGs can be created by using the Calculator to modify the exposure parameters for the composite worker to match the equations that follow.
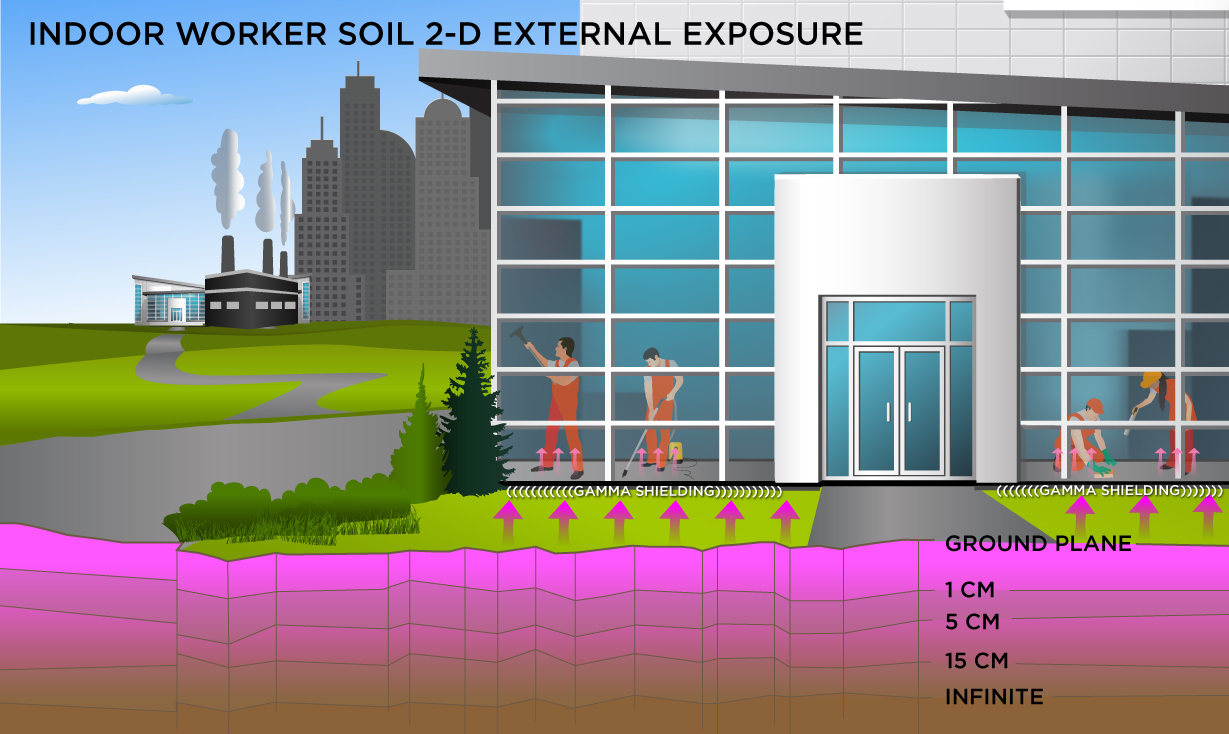
This receptor spends most, if not all, of the workday indoors. Thus, an indoor worker has no direct contact with outdoor soils. A gamma shielding factor is applied for this scenario to account for shielding provided by floors and foundation slabs. This analysis is designed to look at external exposure from contamination of different area sizes. Areas considered are 1 to 1,000,000 square meters. Isotope-specific area correction factor (ACF) were developed for this analysis.
The resulting units for this recommended PRG are in pCi/g. The units are based on mass because the SF used is the soil volume for external exposure.
The resulting units for this recommended PRG are in pCi/g. The units are based on mass because the SF used is the 1cm soil volume for external exposure.
The resulting units for this recommended PRG are in pCi/g. The units are based on mass because the SF used is the 5cm soil volume for external exposure.
The resulting units for this recommended PRG are in pCi/g. The units are based on mass because the SF used is the 15cm soil volume for external exposure.
The resulting units for this recommended PRG are in pCi/cm2. The units are based on area because the SF used is the ground plane for external exposure.
Definitions of the input variables are in Table 1. This is a long-term receptor exposed during the work day who is a full time employee working on-site who spends most, if not all, of the workday indoors. The indoor worker is assumed to be exposed to contaminants via the following pathways: inhalation of ambient air and external radiation from contaminants in ambient air. Two ambient air exposure conditions are offered for this scenario. The first scenario includes a half-life decay function and the second scenario does not. In situations where the contaminant in the air is not being replenished (e.g., an accidental one-time air release from a factory), equations for the first scenario should be used. In situations where the contaminant in the air has a continual source (e.g., indoor radon from radium in the soil, or an operating factory or landfill cap), equations for the second scenario should be used. Two sets of ambient air exposure equations are presented below. The first set of equations include a half-life decay function and the second set of equations does not. In situations where the contaminant in the air is not being replenished (e.g., contaminated settled dust from a previous release that is being resuspended), the first equation should be used. In situations where the contaminant in the air has a continual source (e.g., indoor radon from radium in the soil), the second equation should be used.
The indoor worker ambient air land use equation, presented here, contains the following exposure routes with half-life decay:
The indoor worker ambient air land use equation, presented here, contains the following exposure routes without half-life decay:
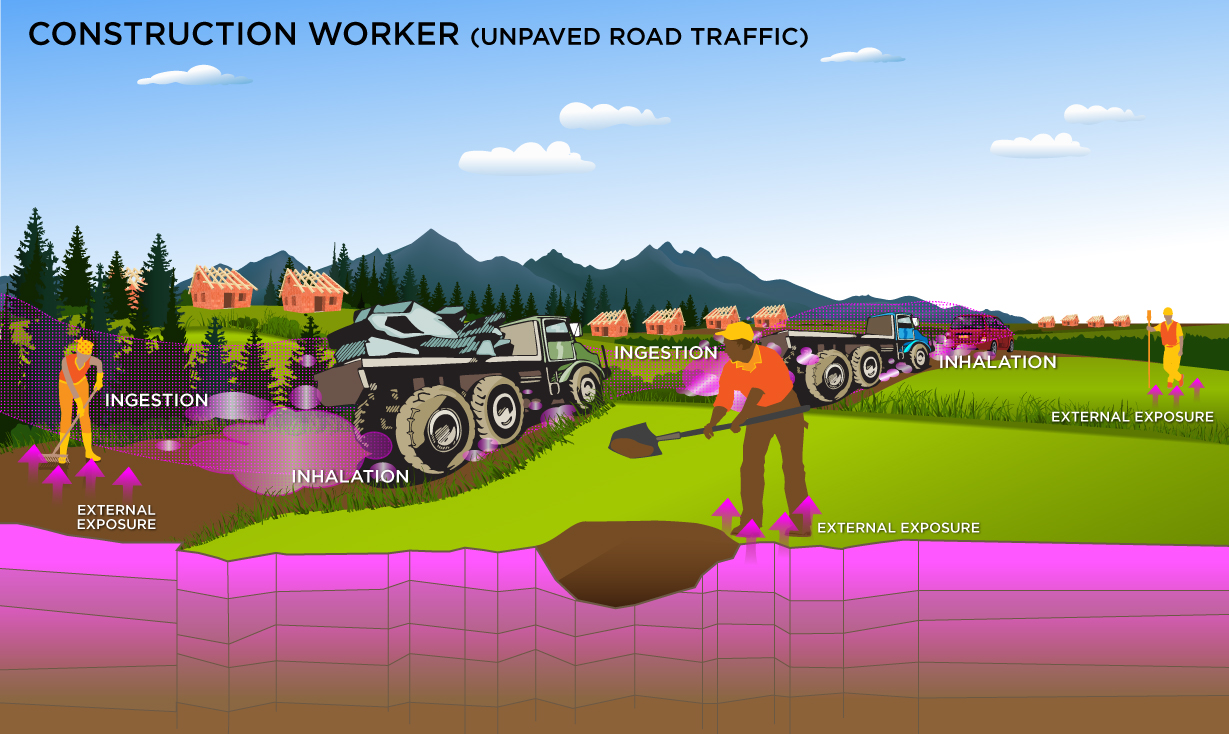
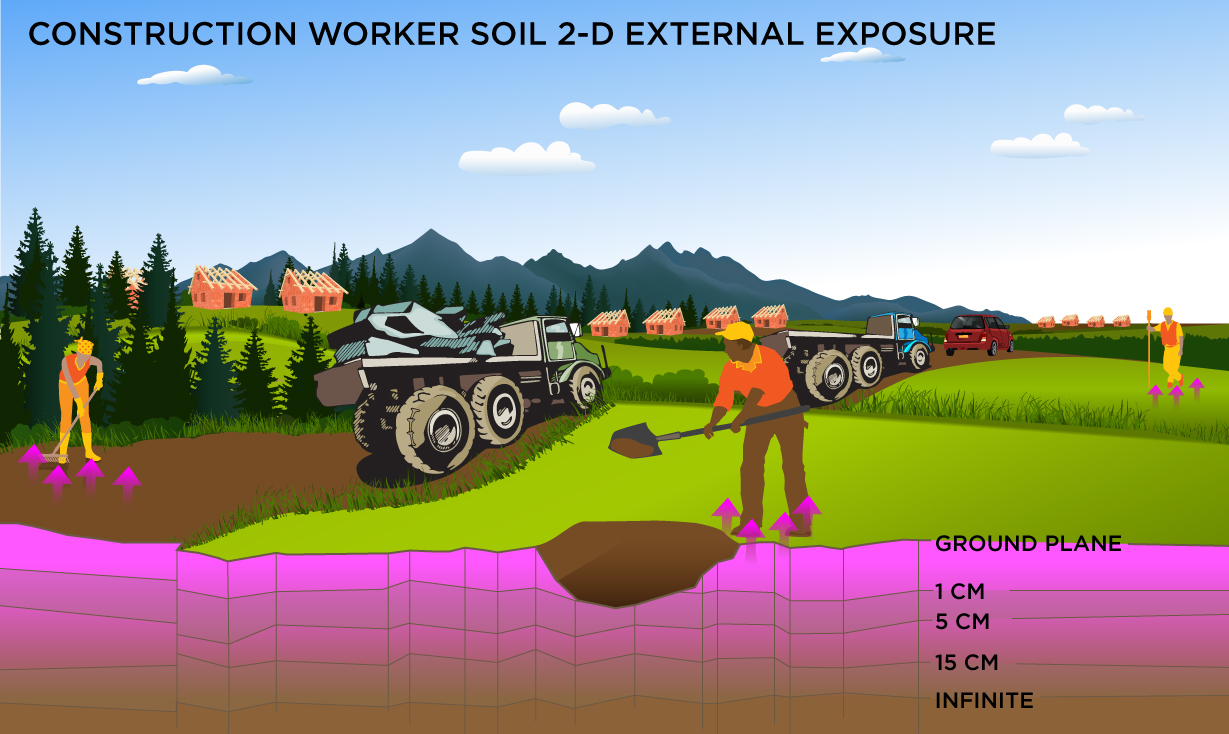
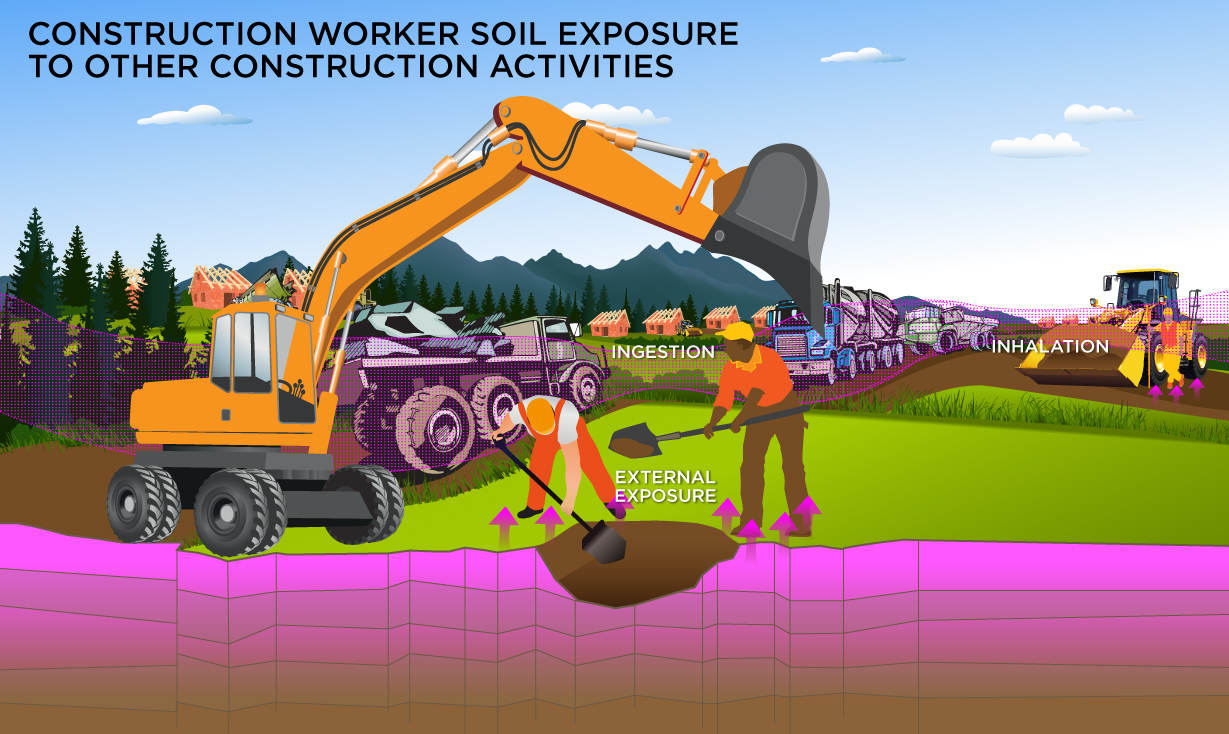
Definitions of the input variables are in Table 1. This is a short-term receptor exposed during the work day working around vehicles suspending dust in the air. The activities for this receptor (e.g., trenching, excavating) typically involve on-site exposures to surface soils. The construction worker is expected to have an elevated soil ingestion rate (330 mg per day) and is assumed to be exposed to contaminants via the following pathways: incidental ingestion of soil, external radiation from contaminants in soil, inhalation of fugitive dust. The only difference between this construction worker and the one described in section 4.12 is that this construction worker uses a different PEF. The construction worker soil land use is not provided in the Generic Tables but PRGs can be created by using the Calculator. The construction land use is described in the supplemental soil screening guidance. This land use is limited to an exposure duration of 1 year and is thus, subchronic. Other unique aspects of this scenario are that the PEF is based on mechanical disturbance of the soil. Two types of mechanical soil disturbance are addressed: standard vehicle traffic and other than standard vehicle traffic (e.g. wind, grading, dozing, tilling and excavating). In general, the intakes and contact rates are all greater than the outdoor worker. Exhibit 5-1 in the supplemental soil screening guidance presents the exposure parameters. This is a short-term receptor exposed during the work day who is a full time employee working on-site and who spends most of the workday conducting maintenance activities outdoors. The activities for this receptor (e.g., trenching, excavating, wind, grading, dozing, and tilling) typically involve on-site exposures to surface soils. This analysis is designed to look at external exposure from contamination of different area sizes. Areas considered are 1 to 1,000,000 square meters. Isotope-specific area correction factor (ACF) were developed for this analysis. The resulting units for this recommended PRG are in pCi/g. The units are based on mass because the SF used is the soil volume for external exposure.
The resulting units for this recommended PRG are in pCi/g. The units are based on mass because the SF used is the 1cm soil volume for external exposure.
The resulting units for this recommended PRG are in pCi/g. The units are based on mass because the SF used is the 5cm soil volume for external exposure.
The resulting units for this recommended PRG are in pCi/g. The units are based on mass because the SF used is the 15cm soil volume for external exposure.
The resulting units for this recommended PRG are in pCi/cm2. The units are based on area because the SF used is the ground plane for external exposure.
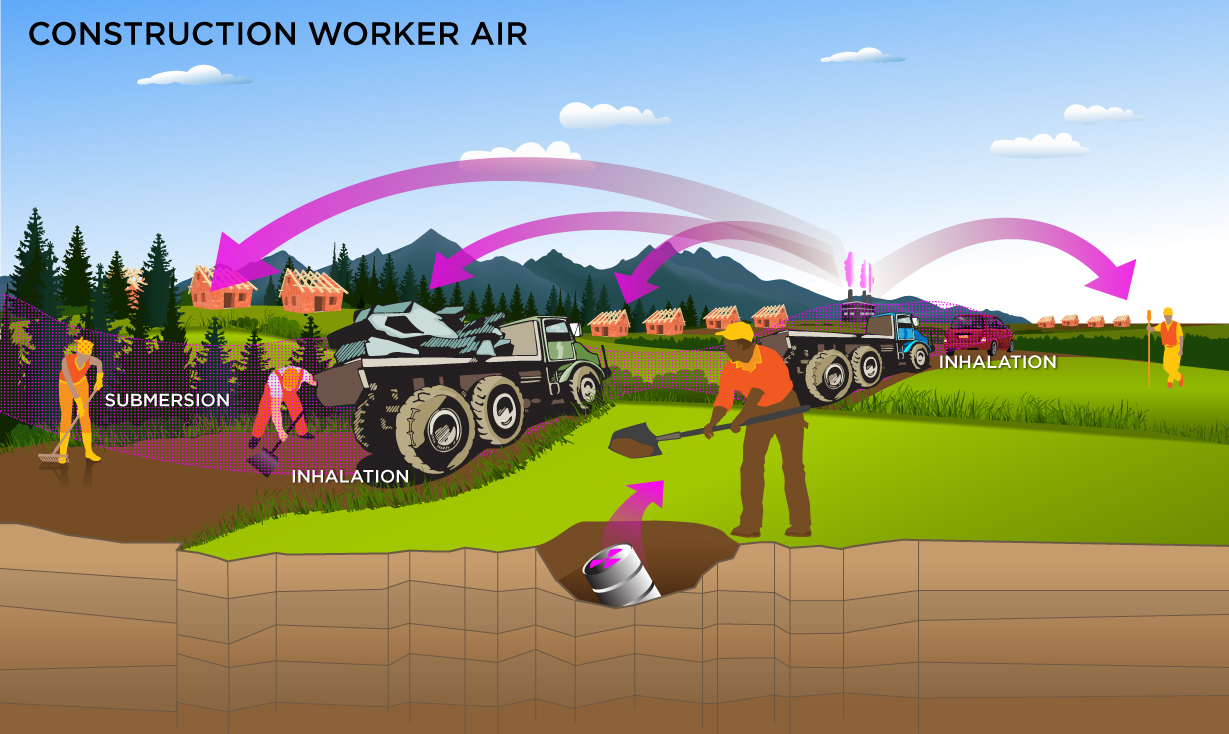
Definitions of the input variables are in Table 1. This is a short-term receptor exposed during the work day during heavy construction activities outdoors. The activities for this receptor (e.g., trenching, excavating, wind, grading, dozing, and tilling) typically involve on-site exposures to surface soils. The construction worker is assumed to be exposed to contaminants via the following pathways: inhalation of ambient air and external radiation from contaminants in ambient air. Two ambient air exposure conditions are offered for this scenario. The first scenario includes a half-life decay function and the second scenario does not. In situations where the contaminant in the air is not being replenished (e.g., an accidental one-time air release from a factory), equations for the first scenario should be used. In situations where the contaminant in the air has a continual source (e.g., indoor radon from radium in the soil, or an operating factory or landfill cap), equations for the second scenario should be used. The construction worker ambient air land use equations, presented here, contain the following exposure routes with half-life decay:
The composite worker ambient air land use equation, presented here, contains the following exposure routes without half-life decay:
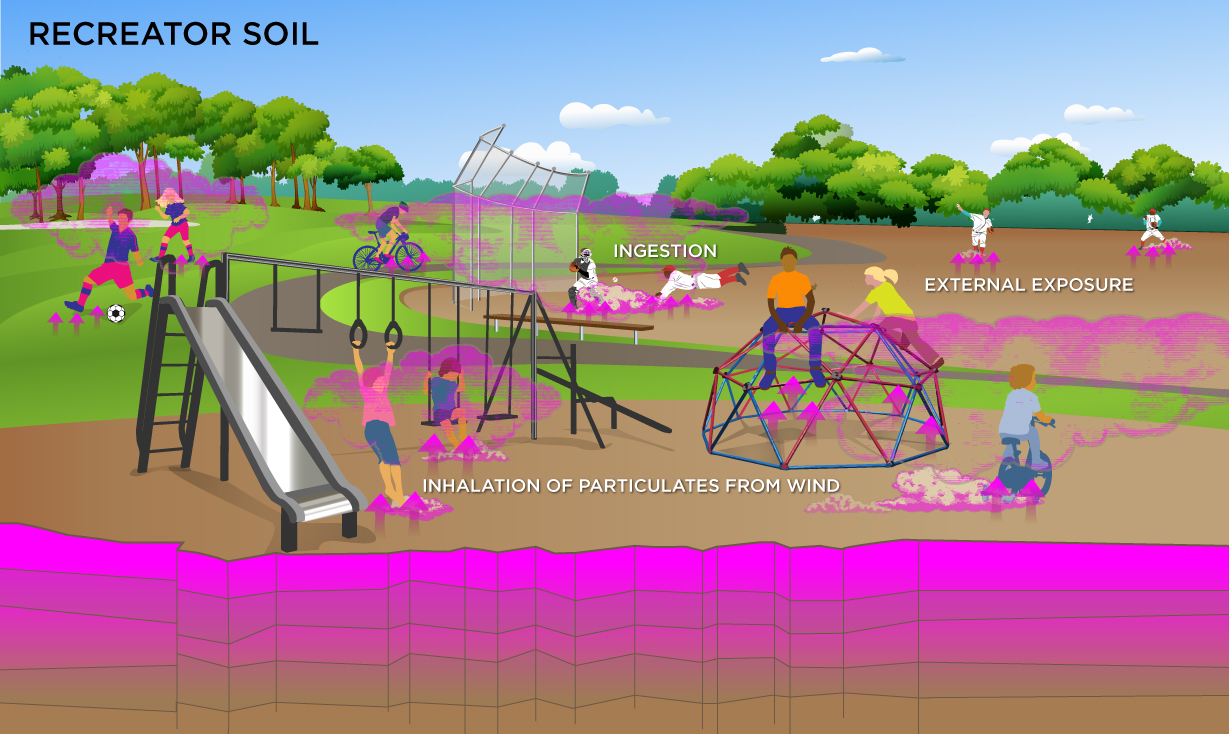
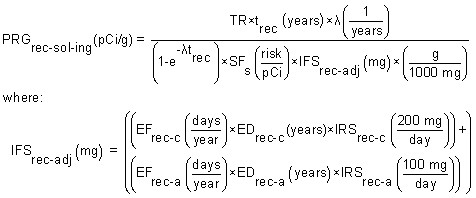
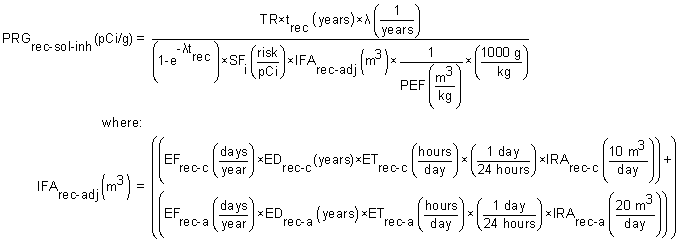
Definitions of the input variables are in Table 1. This is a short-term receptor exposed during the work day working around heavy vehicles suspending dust in the air. The activities for this receptor (e.g., dozing, grading, tilling, dumping, excavating) typically involve on-site exposures to surface soils. The construction worker is expected to have an elevated soil ingestion rate (330 mg per day) and is assumed to be exposed to contaminants via the following pathways: incidental ingestion of soil, external radiation from contaminants in soil, inhalation of fugitive dust. The only difference between this construction worker and the one described in section 4.10 is that this construction worker uses a different PEF. The construction worker soil land use is not provided in the Generic Tables but PRGs can be created by using the Calculator. The construction land use is described in the supplemental soil screening guidance. This land use is limited to an exposure duration of 1 year and is thus, subchronic. Other unique aspects of this scenario are that the PEF is based on mechanical disturbance of the soil. Two types of mechanical soil disturbance are addressed: standard vehicle traffic and other than standard vehicle traffic (e.g. wind, grading, dozing, tilling and excavating). In general, the intakes and contact rates are all greater than the outdoor worker. Exhibit 5-1 in the supplemental soil screening guidance presents the exposure parameters. Definitions of the input variables are in Table 1. This assessment is the same as Unpaved Roads. This assessment is the same as Unpaved Roads. This receptor spends time outside involved in recreational activities. There are no default PRGs for this scenario; only site-specific. This receptor spends time outside involved in recreational activities. There are no default PRGs for this scenario; only site-specific. This analysis is designed to look at external exposure from contamination of different area sizes. Areas considered are 1 to 1,000,000 square meters. Isotope-specific area correction factor (ACF) were developed for this analysis.
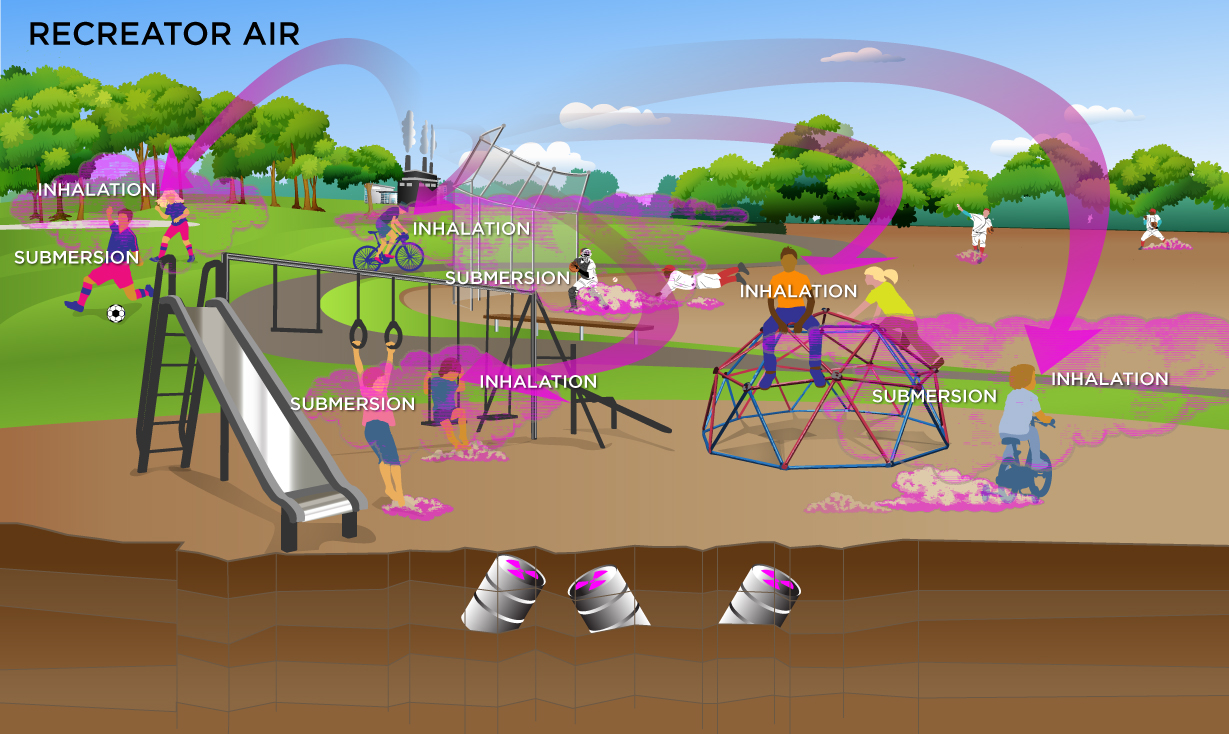
Definitions of the input variables are in Table 1. This receptor spends time involved in recreational activities. There are no default PRGs for this scenario; only site-specific. Two ambient air exposure conditions are offered for this scenario. The first scenario includes a half-life decay function and the second scenario does not. In situations where the contaminant in the air is not being replenished (e.g., an accidental one-time air release from a factory), equations for the first scenario should be used. In situations where the contaminant in the air has a continual source (e.g., indoor radon from radium in the soil, or an operating factory or landfill cap), equations for the second scenario should be used. The recreator ambient air land use equation, presented here, contains the following exposure routes with half-life decay:
The recreator ambient air land use equation, presented here, contains the following exposure routes without half-life decay:
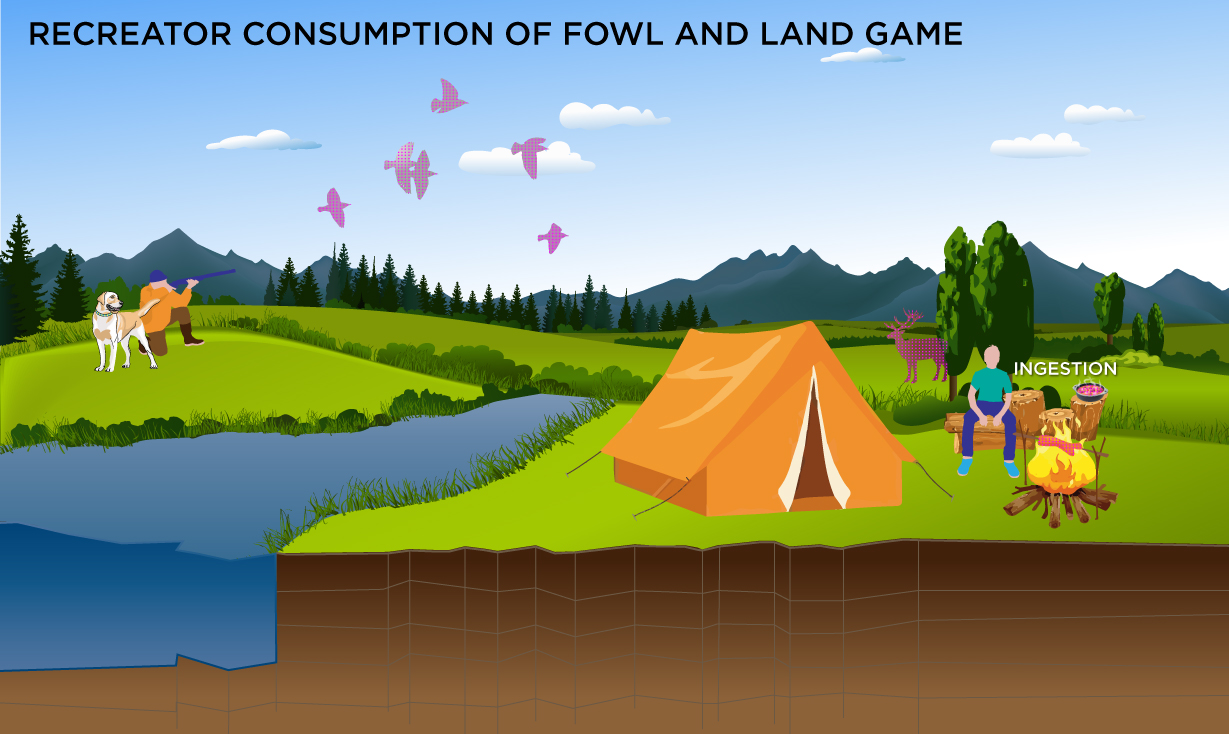
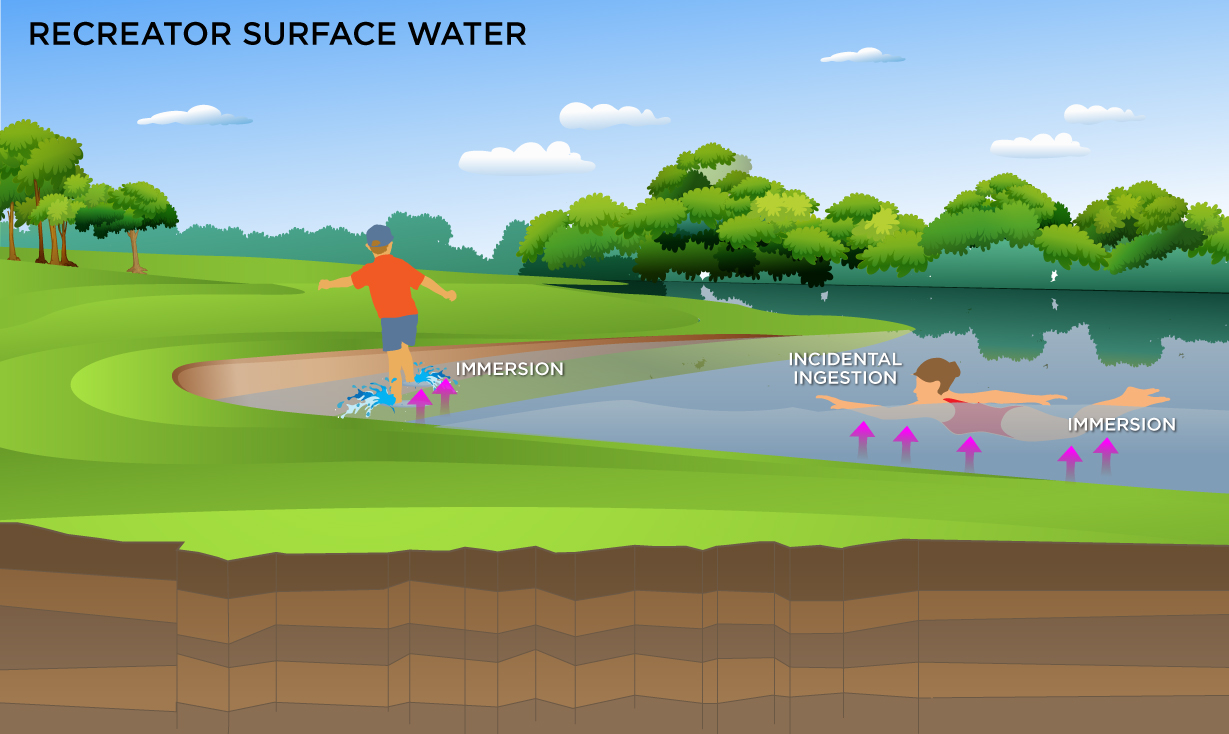
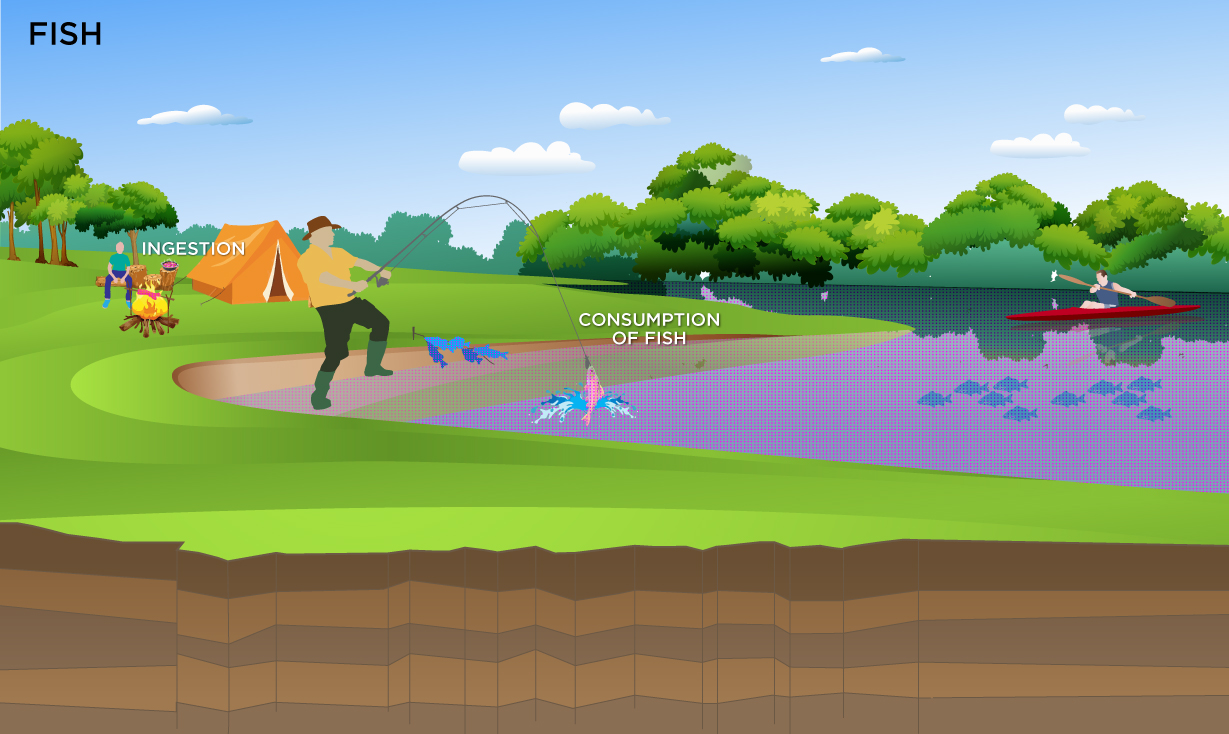
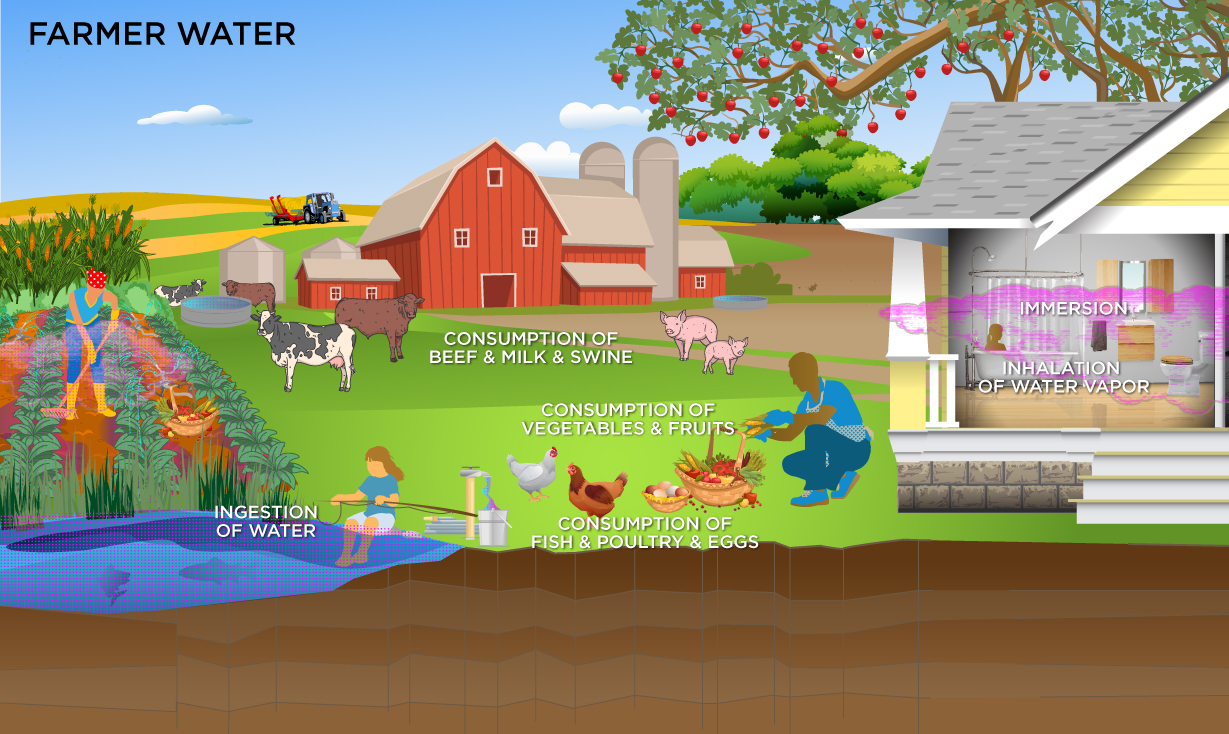
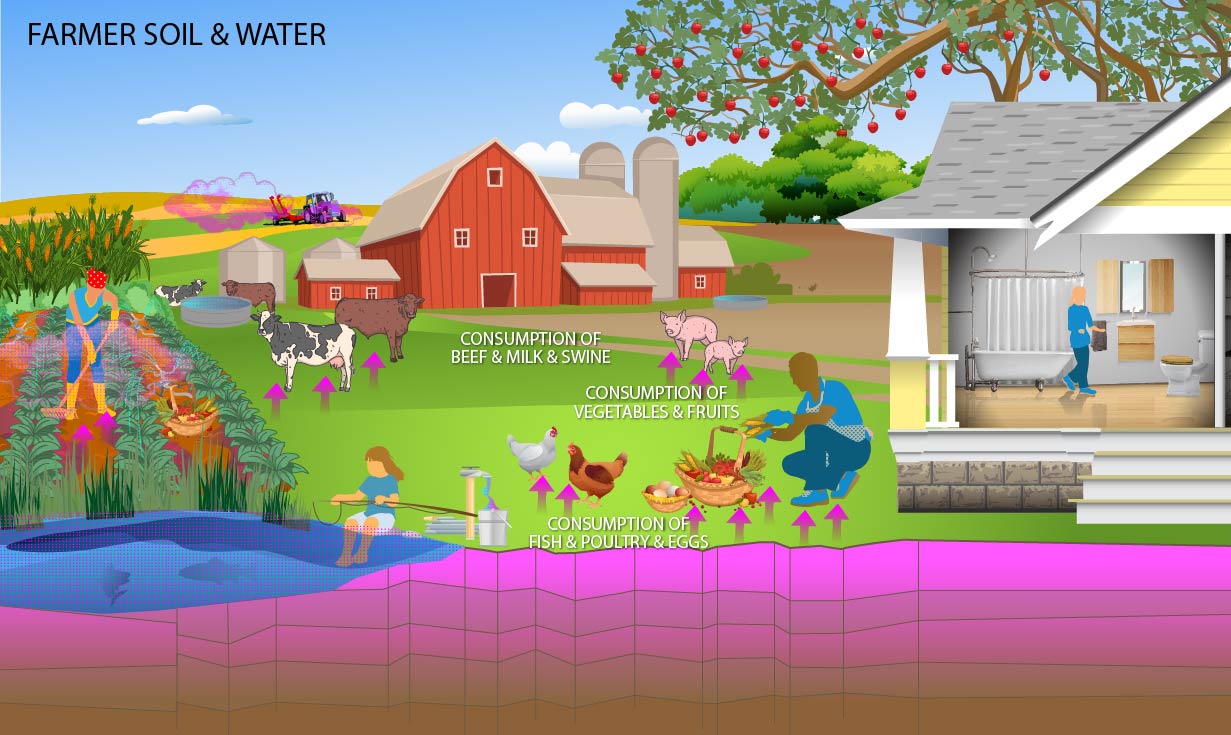
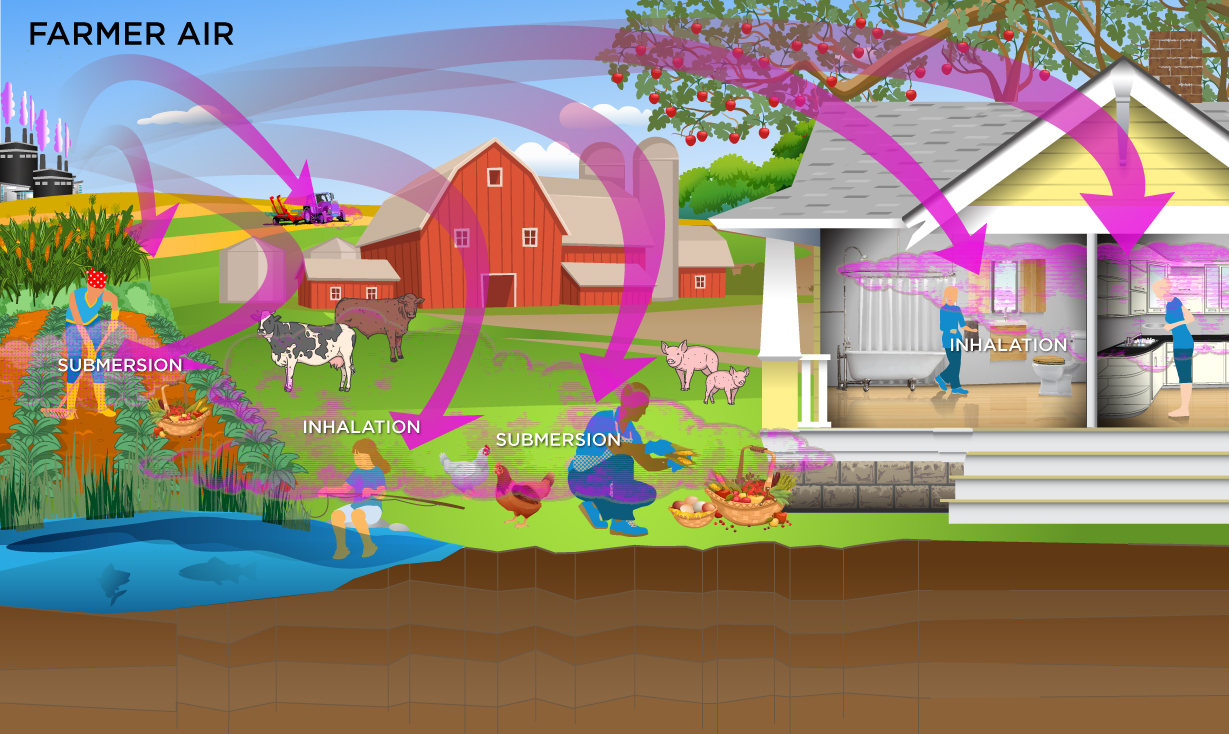
Definitions of the input variables are in Table 1. This receptor spends time involved in recreational hunting of waterfowl and land game. There are no default PRGs for this scenario; only site-specific. The consumption of fowl and game equations, presented here, contains the following exposure routes: The transfer factor for fowl is the same transfer factor used for poultry. The transfer factor for game is the same transfer factor used for beef. Definitions of the input variables are in Table 1. This receptor is exposed to radionuclides that are present in surface water. Ingestion of water and immersion in water are appropriate pathways for all radionuclides. Inhalation is not considered due to mixing with outdoor air. There are no default PRGs for this scenario; only site-specific. The fish PRG represents the concentration, in the fish, that can be consumed. This is unlike the farmer scenario where the RPG is calculated for soil levels protective of fish consumption. Further the ingestion rate is not age adjusted like the farmer scenario. The consumption of fish equation, presented here, contains the following exposure route: Note: the consumption rate for fish is not age adjusted for this land use. Also the PRG calculated for fish is not for soil, like for the farmer land uses, but is for fish tissue. Definitions of the input variables are in Table 1. The farmer scenario should be considered an extension of the resident scenario and evaluate consumption of farm products for a subsistence farmer. Like the resident, the farmer assumes the receptor will be exposed via the consumption of home grown produce (100% of fruit and vegetables are from the farm). In addition to produce, 100% of consumption of the following are also considered to be from the farm: beef, milk, fish, swine, egg and poultry. All feed (100%) for farm products is considered to have been grown on contaminated portions of the site. For these farm products, risk-based PRGs are provided for the farm product itself (produce, beef, milk, etc.). Also like the resident, age-adjusted intake equations were developed for all of the consumption equations to account for changes in intake as the receptor ages. Definitions of the input variables are in Table 1. The farmer scenario should be considered an extension of the resident scenario and evaluate consumption of farm products for a subsistence farmer. Like the resident, the farmer scenario assumes the receptor will be exposed via the following pathways: incidental ingestion of soil, external radiation from contaminants in soil, inhalation of fugitive dust and consumption of home grown produce (100% of fruit and vegetables are from the farm). In addition to produce, 100% of consumption of the following are also considered to be from the farm: beef, milk, fish, swine, egg and poultry. All feed (100%) for farm products is considered to have been grown on contaminated portions of the site. For these farm products, risk-based PRGs are provided for soil which may contribute contaminants to the products. Also like the resident, age-adjusted intake equations were developed for all of the ingestion/consumption equations to account for changes in intake as the receptor ages. The consumption of produce exposure route drives the PRGs lower than all the other routes. It is recommended that produce-specific transfer factors (Bvwet) be used when available for a site. Further, the default transfer factors (Bvwet) from IAEA, used in these PRG calculations, are based on a composite of all soil groups. Transfer factors (Bvwet) for sand, loam, clay, organic, coral sand, and other soil types that may be more suited to a particular site are also provided. The site-specific option of the calculator can be used to focus on ingestion of individual produce types. When "Site-specific" is selected, if the user changes the "Select Isotope Info Type" to "User-provided", then a specific transfer factor may be changed.
where: The following consumption routes are provided in site-specific mode only and requires the user to enter their own data as the tool only provides a transfer factor. Definitions of the input variables are in Table 1. The farmer scenario should be considered an extension of the resident scenario and evaluate consumption of farm products for a subsistence farmer. Like the resident, the farmer scenario assumes the receptor will be exposed via the following pathways: ingestion of tapwater, external radiation from contaminants in tapwater, inhalation of gases in tapwater and consumption of home grown produce (100% of fruit and vegetables are from the farm). The inhalation exposure route is only calculated for C-14, H-3, Ra-224, and Ra-226 which volatilize. In addition to produce, 100% of consumption of the following are also considered to be from the farm: beef, milk, fish, swine, egg and poultry. All water (100%) for farm products is considered to have been provided from contaminated portions of the site. For these farm products, risk-based PRGs are provided for the water which may contribute contaminants to the products. Also like the resident, age-adjusted intake equations were developed for all of the ingestion/consumption equations to account for changes in intake as the receptor ages. where: The following consumption routes are provided in site-specific mode only and requires the user to enter their own data as the tool only provides a transfer factor. Definitions of the input variables are in Table 1. The farmer scenario should be considered an extension of the resident scenario and evaluate consumption of farm products for a subsistence farmer. Like the resident, the farmer scenario assumes the receptor will be exposed via consumption of home grown produce (100% of fruit and vegetables are from the farm). In addition to produce, 100% of consumption of the following are also considered to be from the farm: beef, milk, fish, swine, egg and poultry. All feed and water (100%) for farm products is considered to have been grown on or provided from contaminated portions of the site. For these farm products, risk-based PRGs are provided for both soil and water which may contribute contaminants to the products. The results are presented in an interactive graphic that shows the contribution from both sources. See section 4.26.7 for details. Also like the resident, age-adjusted intake equations were developed for all of the ingestion/consumption equations to account for changes in intake as the receptor ages. Results of back-calculating exposure to soil and water are presented in an interactive graph. See Section 4.26.7 for details. The following consumption routes are provided in site-specific mode only and requires the user to enter their own data as the tool only provides a transfer factor. Results of back-calculating exposure to soil and water are presented in an interactive graph. See Section 4.26.7 for details. Definitions of the input variables are in Table 1. This receptor spends most, if not all, of the day at home except for the hours spent at work. The activities for this receptor involve typical home making chores (cooking, cleaning and laundering) as well as gardening. The resident is assumed to be exposed to contaminants via the following pathways: inhalation of ambient air and external radiation from contaminants in ambient air. To take into account the different inhalation rates for children and adults, age adjusted intake equations were developed to account for changes in intake as the receptor ages. Two ambient air exposure conditions are offered for this scenario. The first scenario includes a half-life decay function and the second scenario does not. In situations where the contaminant in the air is not being replenished (e.g., an accidental one-time air release from a factory), equations for the first scenario should be used. In situations where the contaminant in the air has a continual source (e.g., indoor radon from radium in the soil, or an operating factory or landfill cap), equations for the second scenario should be used. Two ambient air exposure conditions are offered for this scenario. The first scenario includes a half-life decay function and the second scenario does not. In situations where the contaminant in the air is not being replenished (e.g., an accidental one-time air release from a factory), equations for the first scenario should be used. In situations where the contaminant in the air has a continual source (e.g., indoor radon from radium in the soil, or an operating factory or landfill cap), equations for the second scenario should be used. The farmer ambient air land use equation, presented here, contains the following exposure routes with half-life decay: The resident ambient air land use equation, presented here, contains the following exposure routes without half-life decay: Definitions of the input variables are in Table 1. The soil to groundwater scenario was developed to identify concentrations in soil that have the potential to contaminate groundwater above risk based PRGs or MCLs. Migration of contaminants from soil to groundwater can be envisioned as a two-stage process: (1) release of contaminant from soil to soil leachate and (2) transport of the contaminant through the underlying soil and aquifer to a receptor well. The soil to groundwater scenario considers both of these fate and transport mechanisms. First, the acceptable groundwater concentration is multiplied by a dilution factor to obtain a target leachate concentration. For example, if the dilution factor is 10 and the MCL is 0.05 mg/L, the target soil leachate concentration would be 0.5 mg/L. The partition equation (presented in the Soil Screening Guidance for Radionuclides documents) is then used to calculate the total soil concentration corresponding to this soil leachate concentration. The SSL methodology was designed for use during the early stages of a site evaluation when information about subsurface conditions may be limited. Because of this constraint, the methodology is based on conservative, simplifying assumptions about the release and transport of contaminants in the subsurface. The method for calculating SSLs for the migration to groundwater pathway was developed to identify radionuclide concentrations in soil that have the potential to contaminate groundwater above screening levels (i.e., MCLs or risk-based concentrations (RBCs). Migration of radionuclides from soil to groundwater can be envisioned as a two-stage process: (1) release of contaminant in soil leachate and (2) transport of the contaminant through the underlying soil and aquifer to a receptor well. The SSL method considers both of these fate and transport mechanisms. SSLs are back-calculated from acceptable groundwater concentrations. First, the acceptable groundwater concentration is multiplied by a dilution factor to obtain a target leachate concentration. For example, if the dilution factor is 10 and the acceptable groundwater concentration is 10 pCi/L, the target soil leachate concentration would be 100 pCi/L. The partition equation is then used to calculate the total soil concentration (i.e., SSL) corresponding to this soil leachate concentration. The user has the option to choose from two calculation methods. The first method employs the default partitioning equation for migration to groundwater. The dilution factor defaults to 20 for a 0.5-acre source. If the user has all of the parameters needed to calculate a dilution factor, you may use the Method 2 (mass-limit equation for migration to groundwater). Method 1. Partitioning Equation for Migration to Groundwater Method 2. Mass-Limit Equation for Migration to Groundwater Then calculate the dilution factor using this equation. Definitions of the input variables are in Table 1. There are five parts of the above land use equations that require further explanation. The first is the explanation of the inhalation variable: the particulate emission factor (PEF). The second is the use of the radionuclide decay constant (λ). The third is the explanation of the area correction factor (ACF). The fourth is the explanation of the outdoor soil gamma shielding factor (GCFo). The fifth is explanation of the groundwater transport portion of the equations involving the soil to water partition coefficient (Kd). Inhalation of isotopes adsorbed to respirable particles (PM10) was assessed using a default PEF equal to 1.36 x 10⁹ m3/kg. This equation relates the contaminant concentration in soil with the concentration of respirable particles in the air due to fugitive dust emissions from contaminated soils. The generic PEF was derived using default values that correspond to a receptor point concentration of approximately 0.76 ug/m3. The relationship is derived by Cowherd (1985) for a rapid assessment procedure applicable to a typical hazardous waste site, where the surface contamination provides a relatively continuous and constant potential for emission over an extended period of time (e.g. years). This represents an annual average emission rate based on wind erosion that should be compared with chronic health criteria; it is not appropriate for evaluating the potential for more acute exposures. Definitions of the input variables are in Table 1. With the exception of a few radionuclides, the PEF does not appear to significantly affect most PRGs. The equation forms the basis for deriving a generic PEF for the inhalation pathway. For more details regarding specific parameters used in the PEF model, refer to Soil Screening Guidance for Radionuclides: Technical Background Document. The use of alternate values on a specific site should be justified and presented in an Administrative Record if considered in CERCLA remedy selection. Note: the generic PEF evaluates wind-borne emissions and does not consider dust emissions from traffic or other forms of mechanical disturbance that could lead to greater emissions than assumed here. EPA derived a default volatilization factor (VF) value of 17 m3/kg for tritium. The VF replaces the PEF in the PRG equations when tritium is being addressed. This VF value is based on a steady-state model that assumes--on average--tritium in soil pore water and tritium in air (as tritiated water vapor) will be distributed in the environment in proportion to the average water content in soil and air. EPA assumes a mean atmospheric humidity of 6 grams of water per cubic meter of air (g/m3) nationwide (Etnier 1980), and an average soil moisture content of 10%, i.e. , 100 grams of water per kilogram of soil. Given these assumptions, EPA calculates the VF term for tritium as VFH-3 = 100 g H2O/kg soil / 6 g H2O/m3 air = 17 m3 air/kg soil = 17 m3/kg EPA believes that this value is appropriate for the average case, both outdoors and indoors. However, site managers can derive a site-specific VF term for tritium that may be more appropriate for a specific site, considering local atmospheric humidity and soil moisture content. The equation to calculate the subchronic particulate emission factor (PEFsc) is significantly different from the resident and non-resident PEF equations. The PEFsc focuses exclusively on emissions from truck traffic on unpaved roads, which typically contribute the majority of dust emissions during construction. This equation requires estimates of parameters such as the number of days with at least 0.01 inches of rainfall, the mean vehicle weight, and the sum of fleet vehicle distance traveled during construction.
The number of days with at least 0.01 inches of rainfall can be estimated using Exhibit 5-2 in the supplemental soil screening guidance. Mean vehicle weight (W) can be estimated by assuming the numbers and weights of different types of vehicles. For example, assuming that the daily unpaved road traffic consists of 20 two-ton cars and 10 twenty-ton trucks, the mean vehicle weight would be: Other than emissions from unpaved road traffic, the construction worker may also be exposed to particulate matter emissions from wind erosion, excavation soil dumping, dozing, grading, and tilling or similar operations PEF'sc. These operations may occur separately or concurrently and the duration of each operation may be different. For these reasons, the total unit mass emitted from each operation is calculated separately and the sum is normalized over the entire area of contamination and over the entire time during which construction activities take place. Equation E-26 in the supplemental soil screening guidance was used.
The decay constant term (λ), which is based on the half-life of the isotope, is used for some media in nearly all land uses. λ = 0.693/half-life in years (where, 0.693=ln(2)). The term (1 - e-λt) takes into account the number of half-lives that will occur within the exposure duration to calculate an appropriate value. For the secular equilibrium PRG output option, decay is not used. In most cases, site-specific analytical data should be used to establish the actual degree of equilibrium between each parent radionuclide and its decay products in each media sampled. However, in the absence of empirical data, the secular equilibrium PRGs will provide a protective screening value. Definitions of the input variables are in Table 1. The RAGS/HHEM Part B model assumes that an individual is exposed to a source geometry that is effectively an infinite slab. The concept of an infinite slab means that the thickness of the contaminated zone and its aerial extent are so large that it behaves as if it were infinite in its physical dimensions. In practice, soil contaminated to a depth greater than about 15 cm and with an aerial extent greater than about 1,000 m2 will create a radiation field comparable to that of an infinite slab. (U.S. EPA. 2000a) To accommodate the fact that in most residential settings the assumption of an infinite slab source will result in overly conservative PRGs, an adjustment for source area is considered to be an important modification to the RAGS/HHEM Part B model. Thus, an area correction factor, ACF, has been added to the calculation of recommended PRGs. For the 2-D exposure models addressing finite areas, the ACF is made variable by isotope and area for site-specific analysis. In addition, ACFs are now available for all alternate soil analysis source depths (ground plane, 1 cm, 5 cm and 15 cm source volumes as well as infinite source volume). This calculator allows the user to select from 19 different soil area sizes. If the default mode is selected, the ACF from the most protective area size is selected. If site-specific mode is selected, the user must select the source area. For further information on the derivation of the isotope-specific/area-specific ACF values for 2-D areas see the Center for Radiation Protection Knowledge ACF report and appendix containing +D and +E values. For the calculation of area correction factors, a standard soil density of 1.6 g/cm3 has been used. For a description of other EPA default ACF values that predate this guidance, follow the link here. PRGs in this guidance are calculated without any shielding between the receptor and the source (soil). In this case, a default soil gamma shielding factor for outdoor exposure to ionizing radiation (GSFo is established at 1.0 (0% shielding). It is common to have some shielding (soil cover) over contaminated soil. When the calculator is ran in site-specific mode the user must select a soil cover depth. Due to shielding, covering the contaminated area with soil will produce lower dose and risk coefficients than are stated in the Federal Guidance Report (FGR) 12 and 13. Therefore, gamma shielding factors are needed to apply the published EPA risk values to the buried contamination scenarios. Outdoor gamma shielding factors (GSFo) are derived by modeling various thicknesses of clean soil covering ground soil contamination. The gamma shielding factor is defined as the ratio of the dose corresponding to covered contamination to that of an unshielded surface source in soil. The MCNP output was used to derive kerma values one meter above the soil surface for various scenarios ranging from 0 cm soil cover to 100 cm soil cover in 10 cm increments while using source thicknesses of ground plane, 1, 5 and 15 cm source volumes as well as infinite source volume. Radioisotopes published in ICRP 107 were considered, along with decay chains of several radioisotopes. The Center for Radiation Protection Knowledge has provided GSFo values here and an appendix containing +D and +E values. Additional source depth-specific soil gamma shielding factors (GSF) are now given for cover depths of 2 to 10 meters. The values are presented in this appendix. When multiple media are contributing to the overall site risk, it may be more practical to remediate one medium vs another. In the case of the farmer scenario, water and soil may both contribute to the risk from ingesting produce, milk, beef, swine, poultry, eggs, and fish. Sheep, sheep milk, goat, and goat milk will be available for selection in site-specific mode, provided the user is able to provide intake rate data for children and adults. The graph shows the PRGs for soil and water to achieve the target risk or target hazard index for the exposure route of concern.
Table 1 presents the definitions of the variables and their default values. The PRG default values and exposure models are consistent with the Dose Compliance Concentrations for Radionuclides (DCC) calculator. Both the PRG and DCC calculator default values are consistent with the Regional Screening Levels for Chemical Contaminants at Superfund Sites (RSL) calculator where the same pathways are addressed (e.g., ingestion and inhalation) and are analogous where pathways are similar (e.g., dermal and external exposure). This calculator, the DCC, and the RSL, all follow the recommendations in the OSWER Directive concerning use of exposure parameters from the 2011 Exposure Factors Handbook. Any alternative values or assumptions used in remedy evaluation or selection on a CERCLA site should be presented with supporting rationale in Administrative Records.
Open All Sections | Close All Sections
Disclaimer
1. Introduction
2. Understanding the PRG Website
2.1 General Considerations
2.2 PRG Output Options
2.2.1 PRG Output Option #1: Assumes Secular Equilibrium Throughout the Chain (no decay)
2.2.2 PRG Output Option #2: Does Not Assume Secular Equilibrium, Provides Results for Progeny Throughout Chain (with decay)
2.2.3 PRG Output Option #3: Does Not Assume Secular Equilibrium, No Progeny Included (with decay)
2.3 Slope Factors (SFs)
2.3.1 Metastable Isotopes
2.4 Radionuclide-Specific Parameters
2.4.1 Sources
2.4.2 Hierarchy by Parameter
Bvwet and Bvdry can be determined using the following equations.
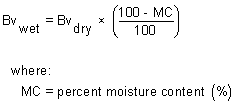
and: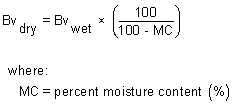
2.5 Biota Modeling
2.5.1 Produce Modeling
2.5.1.1 Intake Rates (g/day)
Table 2.4.1-A
Intake Rate for Farmer Child (g/day) (FW)
Intake Rate for Farmer Adult (g/day) (FW)
Intake Rate for Resident Child (g/day) (FW)
Intake Rate for Resident Adult (g/day) (FW)
Intake Rate for Farmer Child (g/day) (CPW)
Intake Rate for Farmer Adult (g/day) (CPW)
Intake Rate for Resident Child (g/day) (CPW)
Intake Rate for Resident Adult (g/day) (CPW)
Apples
82.9
84.7
72.2
73.7
43.0
43.9
37.4
38.2
Citrus
194.4
309.4
194.1
309.4
100.6
160.4
100.6
160.4
Berries other than Strawberries
23.9
35.4
23.9
35.4
12.4
18.3
12.4
18.3
Peaches
99.3
103.1
111.4
115.7
51.5
53.5
57.7
60.0
Pears
76.9
59.9
66.7
51.9
39.9
31.1
34.6
26.9
Strawberries
25.3
40.5
25.3
40.5
13.1
21.0
13.1
21.0
Asparagas
12.0
39.3
12.0
39.3
8.2
26.8
8.2
26.8
Beets
3.9
33.9
3.9
33.9
2.7
23.2
2.7
23.2
Broccoli
14.4
35.3
13.1
32.0
9.9
24.1
8.9
21.9
Cabbage
11.5
85.7
12.3
92.1
7.8
58.6
8.4
62.9
Carrots
13.3
24.4
14.9
27.3
9.1
16.6
10.2
18.7
Corn
32.7
82.0
23.8
59.8
22.3
56.0
16.3
40.9
Cucumbers
16.9
54.9
25.4
82.4
11.5
37.5
17.3
56.3
Lettuce
4.2
37.5
4.2
37.5
2.9
25.6
2.9
25.6
Lima Beans
6.5
33.8
6.5
33.8
4.5
23.1
4.5
23.1
Okra
5.3
30.2
5.3
30.2
3.6
20.7
3.6
20.7
Onions
7.2
27.2
5.8
21.8
4.9
18.6
4.0
14.9
Peas
28.7
31.7
32.1
35.4
19.6
21.7
21.9
24.2
Pumpkins
45.2
64.8
45.2
64.8
30.9
44.2
30.9
44.2
Snap Beans
27.5
54.2
27.3
53.9
18.8
37.0
18.7
36.8
Tomatoes
34.9
94.2
29.7
80.3
23.8
64.4
20.3
54.8
White Potatoes
57.3
141.8
51.7
127.8
39.1
96.9
35.3
87.3
Table 2.4.1-B
Intake Rate for Farmer Child (g/day) (DW)
Intake Rate for Farmer Adult (g/day) (DW)
Intake Rate for Resident Child (g/day) (DW)
Intake Rate for Resident Adult (g/day) (DW)
Rice
34.8
88.5
28.8
73.2
Cereal Grain
46.0
91.9
38.0
76.0
2.5.1.2 Soil to Plant Transfer Factors (Bvwet)
Climate Zones
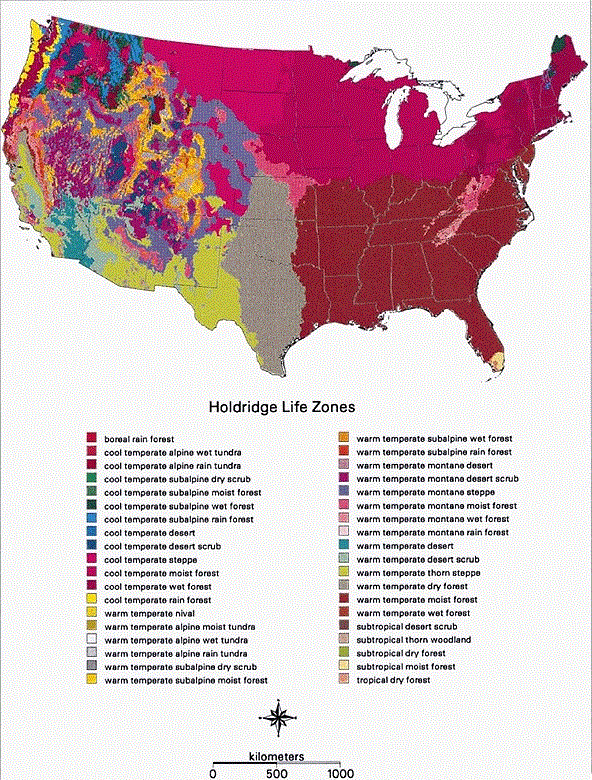
Soil Types
Produce Types
Produce Type
Primary Transfer Factor Category
Primary Transfer Factor Source
Secondary Transfer Factor Category
Secondary Transfer Factor Source
Tertiary Transfer Factor Category
Tertiary Transfer Factor Source
Apples
Woody Tree
IAEA
Fruit
EA
None
NCRP-123, RADSSL, RESRAD, and Baes
Citrus
Woody Tree
IAEA
Fruit
EA
None
NCRP-123, RADSSL, RESRAD, and Baes
Berries other than Strawberries
Shrub
IAEA
Fruit
EA
None
NCRP-123, RADSSL, RESRAD, and Baes
Peaches
Woody Tree
IAEA
Fruit
EA
None
NCRP-123, RADSSL, RESRAD, and Baes
Pears
Woody Tree
IAEA
Fruit
EA
None
NCRP-123, RADSSL, RESRAD, and Baes
Strawberries
Herbaceous
IAEA
Fruit
EA
None
NCRP-123, RADSSL, RESRAD, and Baes
Asparagas
Leafy Vegetable
IAEA
Green Vegetable
EA
None
NCRP-123, RADSSL, RESRAD, and Baes
Beets
Root
IAEA
Root Vegetable
EA
None
NCRP-123, RADSSL, RESRAD, and Baes
Broccoli
Non-Leafy Vegetable
IAEA
Green Vegetable
EA
None
NCRP-123, RADSSL, RESRAD, and Baes
Cabbage
Leafy Vegetable
IAEA
Green Vegetable
EA
None
NCRP-123, RADSSL, RESRAD, and Baes
Carrots
Root
IAEA
Root Vegetable
EA
None
NCRP-123, RADSSL, RESRAD, and Baes
Corn
Maize Grain
IAEA
Green Vegetable
EA
None
NCRP-123, RADSSL, RESRAD, and Baes
Cucumbers
Non-Leafy Vegetable
IAEA
Green Vegetable
EA
None
NCRP-123, RADSSL, RESRAD, and Baes
Lettuce
Leafy Vegetable
IAEA
Green Vegetable
EA
None
NCRP-123, RADSSL, RESRAD, and Baes
Lima Beans
Legume Seed
IAEA
Green Vegetable
EA
None
NCRP-123, RADSSL, RESRAD, and Baes
Okra
Non-Leafy Vegetable
IAEA
Green Vegetable
EA
None
NCRP-123, RADSSL, RESRAD, and Baes
Onions
Non-Leafy Vegetable
IAEA
Root Vegetable
EA
None
NCRP-123, RADSSL, RESRAD, and Baes
Peas
Legume Seed
IAEA
Green Vegetable
EA
None
NCRP-123, RADSSL, RESRAD, and Baes
Pumpkins
Non-Leafy Vegetable
IAEA
Green Vegetable
EA
None
NCRP-123, RADSSL, RESRAD, and Baes
Snap Beans
Legume Seed
IAEA
Green Vegetable
EA
None
NCRP-123, RADSSL, RESRAD, and Baes
Tomatoes
Non-Leafy Vegetable
IAEA
Green Vegetable
EA
None
NCRP-123, RADSSL, RESRAD, and Baes
White Potatoes
Tuber
IAEA
Root Vegetable
EA
None
NCRP-123, RADSSL, RESRAD, and Baes
Rice
Rice
IAEA
None
NCRP-123
None
RADSSL, RESRAD, and Baes
Cereal Grain
Cereal Grain
IAEA
None
NCRP-123
None
RADSSL, RESRAD, and Baes
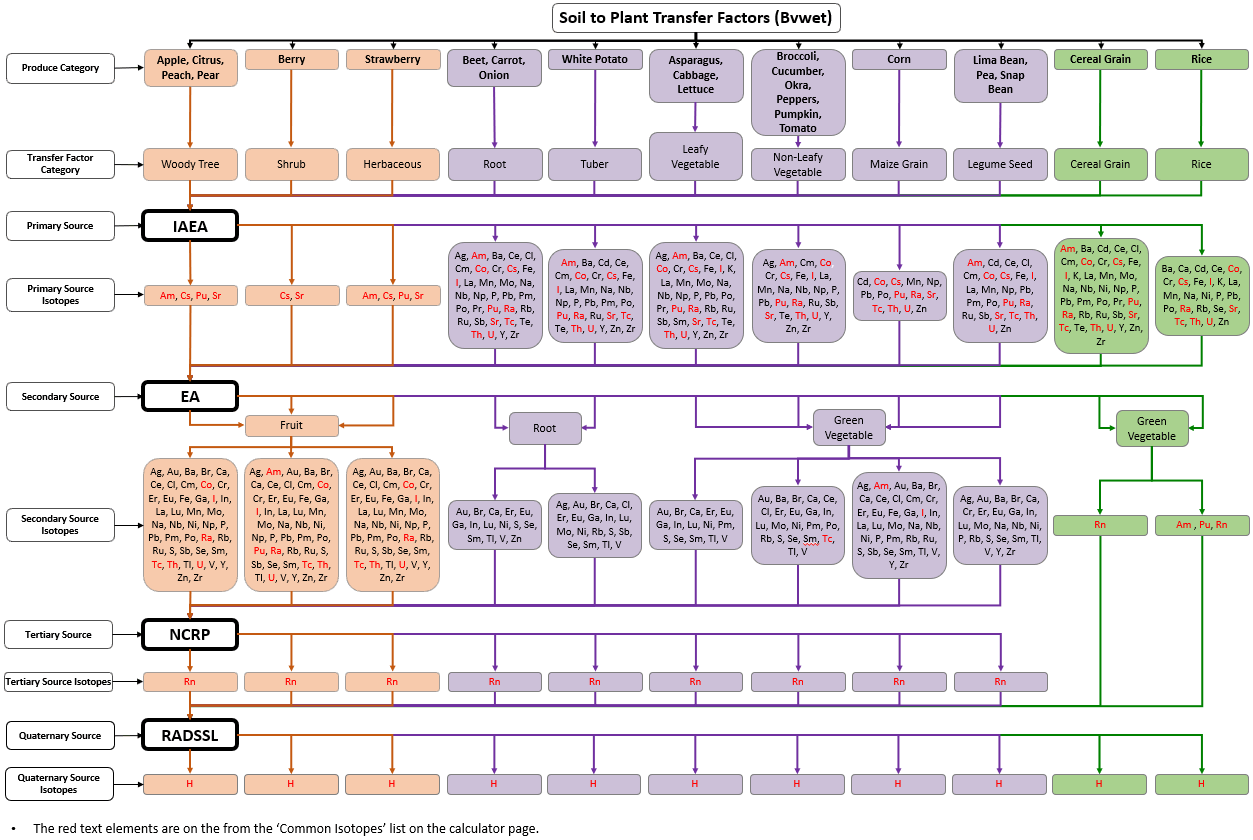
2.5.2 Animal Product Modeling
2.5.2.1 Intake Rates (g/day)
Table 2.4.2-A
Intake Rate for Farmer Child (g/day) (FW)
Intake Rate for Farmer Adult (g/day) (FW)
Intake Rate for Farmer Child (g/day) (CPW)
Intake Rate for Farmer Adult (g/day) (CPW)
Dairy - Cow
994.7
676.4
994.7
676.4
Beef
62.8
165.3
31.1
81.7
Swine
33.7
92.5
16.6
45.7
Poultry
46.9
107.4
23.2
53.1
Egg
31.7
59.6
31.7
59.6
Fish
57.4
831.8
35.2
509.9
Table 2.4.2-B
Intake Rate for Farmer Child (g/day) (FW)
Intake Rate for Farmer Adult (g/day) (FW)
Intake Rate for Farmer Child (g/day) (CPW)
Intake Rate for Farmer Adult (g/day) (CPW)
Sheep
n/a
n/a
n/a
n/a
Sheep Milk
n/a
n/a
n/a
n/a
Goat
n/a
n/a
n/a
n/a
Goat Milk
n/a
n/a
n/a
n/a
2.5.3 Mass Loading Factor
Table 2.4.3-A
Mass Loading Facotr (MLF)
Units
Reference
Apples
1.60E-04
g dry soil / g fresh plant
EA (2009)
Citrus
1.57E-04
g dry soil / g fresh plant
EA (2009)
Berries other than Strawberries
1.66E-04
g dry soil / g fresh plant
EA (2009)
Peaches
1.50E-04
g dry soil / g fresh plant
EA (2009)
Pears
1.60E-04
g dry soil / g fresh plant
EA (2009)
Strawberries
8.00E-05
g dry soil / g fresh plant
EA (2009)
Asparagas
7.90E-05
g dry soil / g fresh plant
EA (2009)
Beets
1.38E-04
g dry soil / g fresh plant
EA (2009)
Broccoli
1.01E-03
g dry soil / g fresh plant
Hinton (1992), SSG-Appendix G
Cabbage
1.05E-04
g dry soil / g fresh plant
EA (2009)
Carrots
9.70E-05
g dry soil / g fresh plant
EA (2009)
Corn
1.45E-04
g dry soil / g fresh plant
Pinder & McLeod (1989), SSG-Appendix G
Cucumbers
4.00E-05
g dry soil / g fresh plant
EA (2009)
Lettuce
1.35E-02
g dry soil / g fresh plant
Hinton (1992), SSG-Appendix G
Lima Beans
3.83E-03
g dry soil / g fresh plant
Hinton (1992), SSG-Appendix G
Okra
8.00E-05
g dry soil / g fresh plant
EA (2009)
Onions
9.70E-05
g dry soil / g fresh plant
EA (2009)
Peas
1.78E-04
g dry soil / g fresh plant
EA (2009)
Pumpkins
5.80E-05
g dry soil / g fresh plant
EA (2009)
Snap Beans
5.00E-03
g dry soil / g fresh plant
Hinton (1992), SSG-Appendix G
Tomatoes
1.59E-03
g dry soil / g fresh plant
Hinton (1992), SSG-Appendix G
White Potatoes
2.10E-04
g dry soil / g fresh plant
EA (2009)
Cereal Grains
2.50E-01
g dry soil / g dry plant
Hinton (1992)
Rice
2.50E-01
g dry soil / g dry plant
Hinton (1992)
Pasture
2.50E-01
g dry soil / g dry plant
Hinton (1992)
2.5.4 Soil to Plant Transfer Factor Derivation for Carbon
2.6 PRGs in Context of Superfund Modeling Framework
2.7 Understanding Risk Output on the PRG Website
2.7.1 General Considerations for the Risk Output
where:
Risk = a unitless probability of an individual developing cancer over a lifetime, determined with the equation above;
C = Concentration entered by the user in site-specific mode [pCi/g ; pCi/cm2 ; pCi/m3 ; pCi/L]
TR = Target Risk provided by the user in site-specific mode
PRG = Preliminary Remediation Goal, determined by the values entered by the user in site-specific mode [pCi/g ; pCi/cm2 ; pCi/m3 ; pCi/L]2.7.2 General Considerations for Entering Site Data
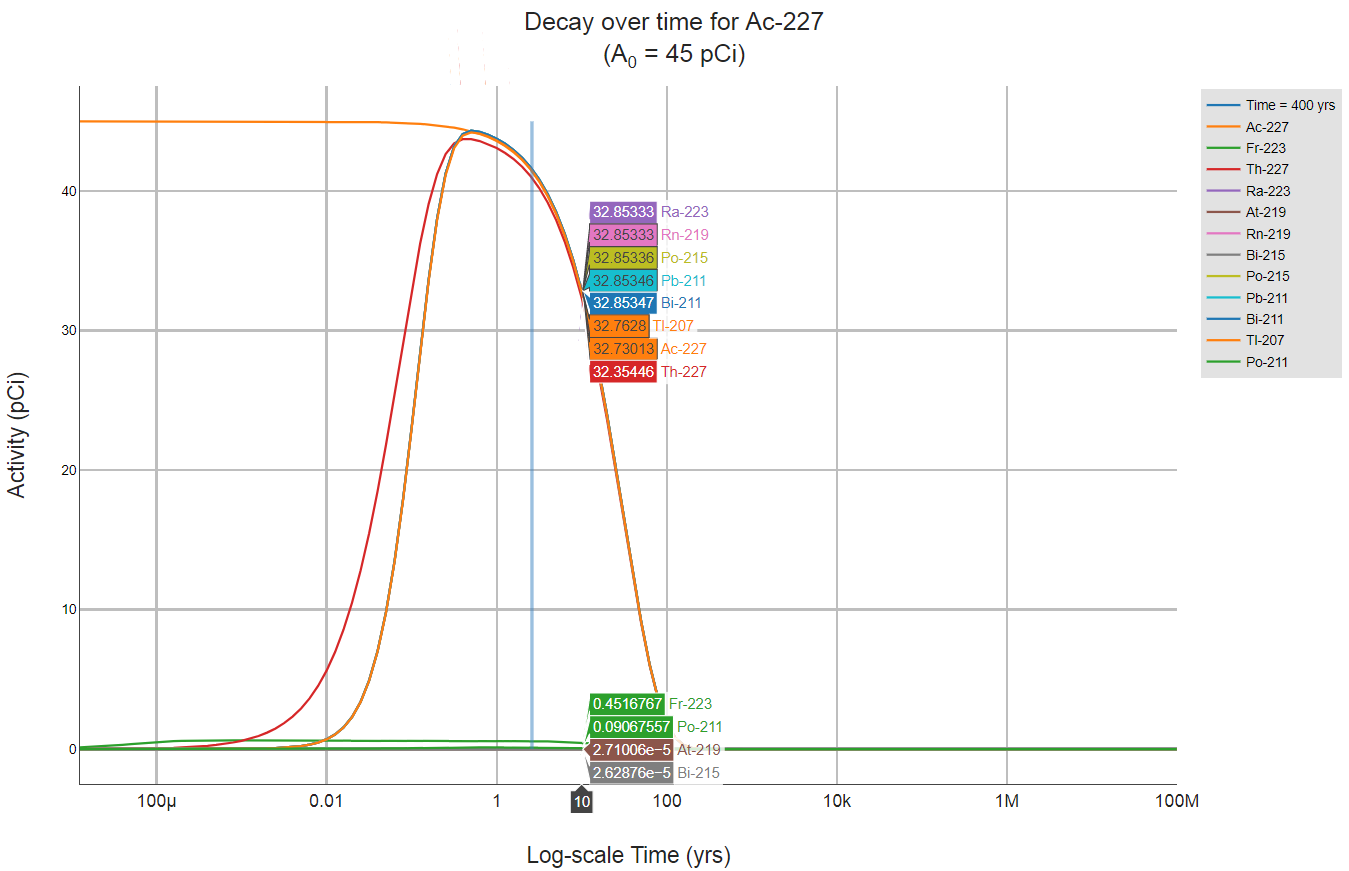
2.7.3 One-Hit Rule
3. Using the PRG Table
3.1 Developing a Conceptual Site Model

3.2 Background Radiation
3.3 Potential Problems and Limitations
4. Land Use Descriptions, Equations, and Technical Documentation
4.1 Resident
4.1.1 Resident Soil
Equations
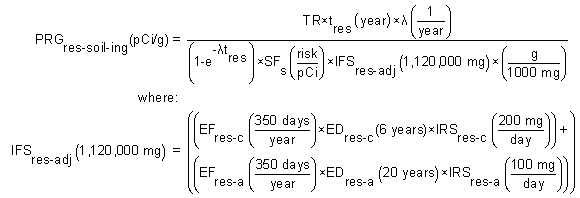


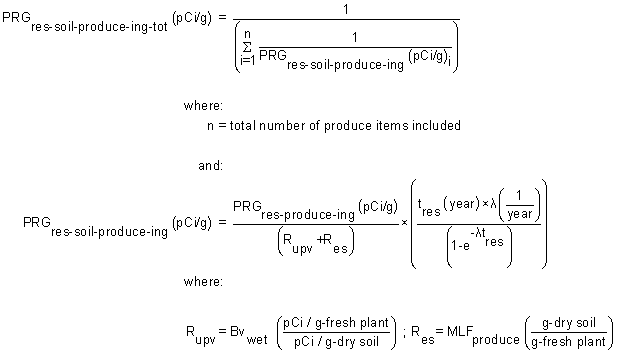


4.1.2 Resident Soil 2-D External Exposure
Equations


4.1.3 Resident Air
Equations


4.1.4 Resident Tapwater
Equations


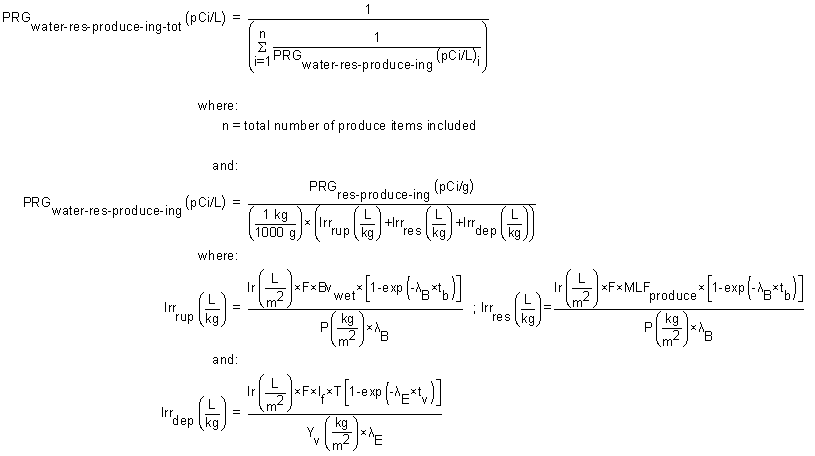
where:


4.2 Composite Worker
4.2.1 Composite Worker Soil
4.2.2 Composite Worker Soil 2-D External Exposure
Equations


4.2.3 Composite Worker Air
Equations


4.3 Outdoor Worker
4.3.1 Outdoor Worker Soil
4.3.2 Outdoor Worker Soil 2-D External Exposure
Equations


4.3.3 Outdoor Worker Air
Equations


4.4 Indoor Worker
4.4.1 Indoor Worker Soil
4.4.2 Indoor Worker Soil 2-D External Exposure
Equations


4.4.3 Indoor Worker Air
Equations


4.5 Construction Worker
4.5.1 Construction Worker Soil Exposure to Unpaved Road Traffic
4.5.2 Construction Worker Soil Exposure to Unpaved Road Traffic 2-D External Exposure
Equations


4.5.3 Construction Worker Air
Equations


4.5.4 Construction Worker Soil Exposure to Other Construction Activities
Equations


4.5.4.1 Construction Worker Soil Exposure to Other Construction Activities 2-D External Exposure
4.5.4.2 Construction Worker Air from Exposure to Other Construction Activities
4.6 Recreator
4.6.1 Recreator Soil
4.6.2 Recreator Soil 2-D External Exposure
Equations


4.6.3 Recreator Air
Equations


4.6.4 Recreator Consumption of Fowl and Land Game
Equations


4.6.5 Recreator Surface Water
4.7 Consumption of Fish
Equation

4.8 Farmer
4.8.1 Farmer Direct Consumption of Agricultural Products
Graphical Representation
Agricultural Biota, Soil and Water Graphic and Supporting Text
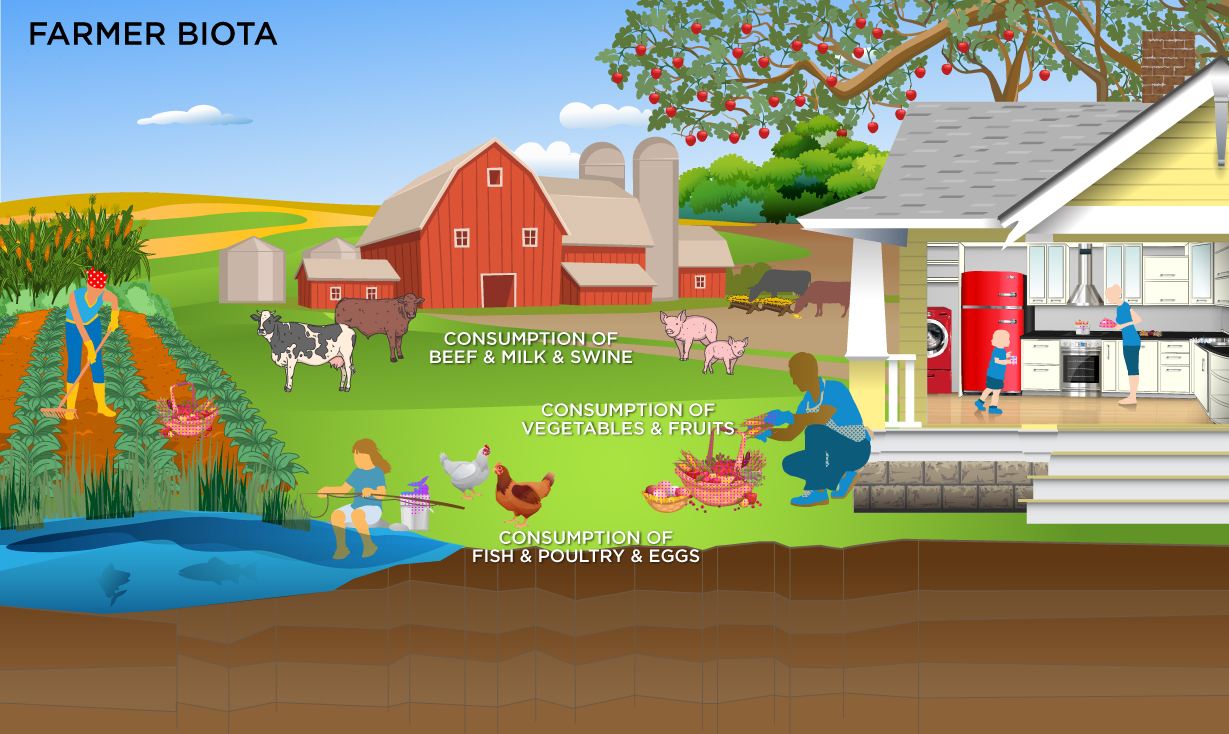
Equations
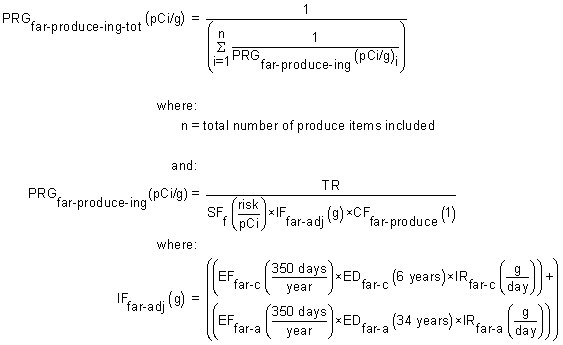


4.8.2 Farmer Direct Exposure and Consumption of Agricultural Products - Back Calculated to Soil
Equations
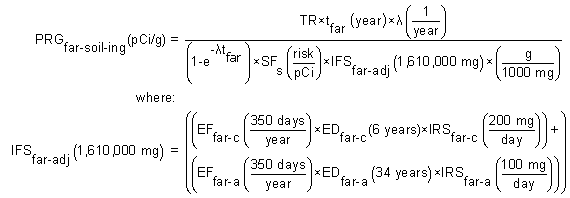


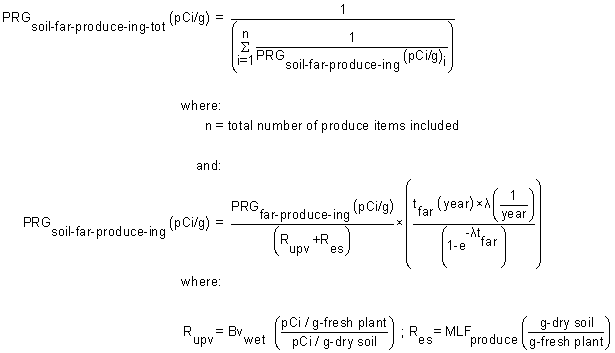
Sections 9 and 13 of the 2011 Exposure Factors Handbook were used to derive the intakes for home-grown produce.


4.8.3 Farmer Direct Exposure and Consumption of Agricultural Products - Back Calculated to Water
Equations


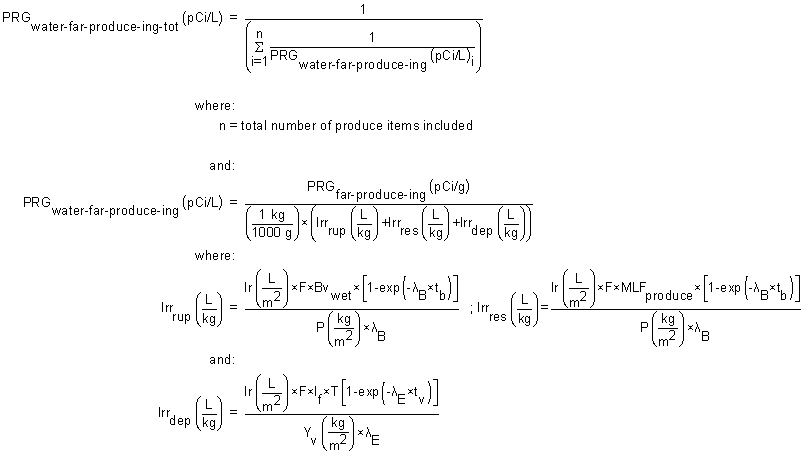


4.8.4 Farmer Consumption of Agricultural Products - Back Calculated to Soil and Water
Equations
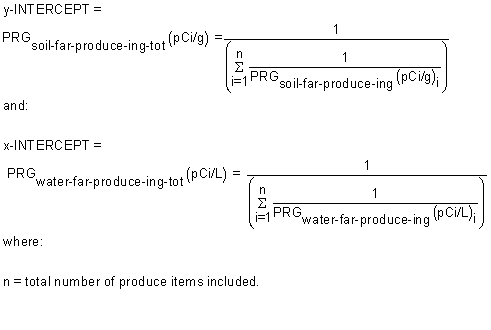
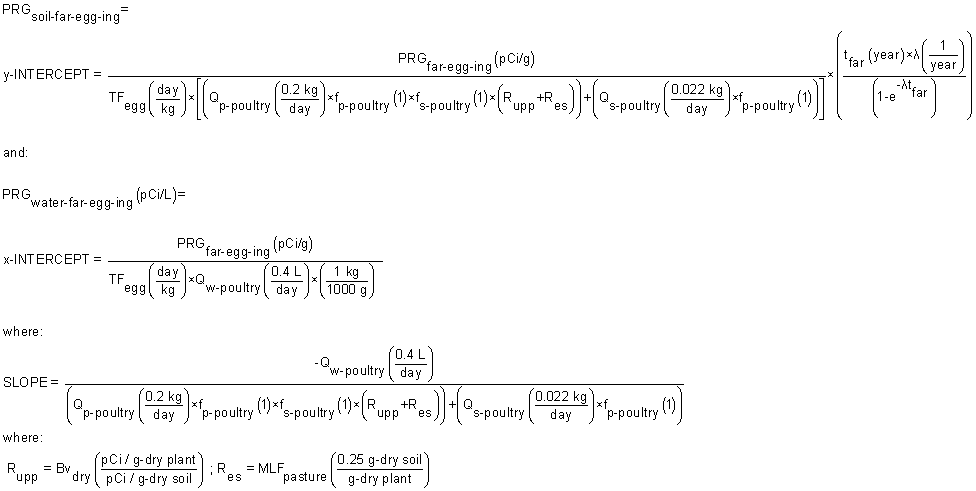
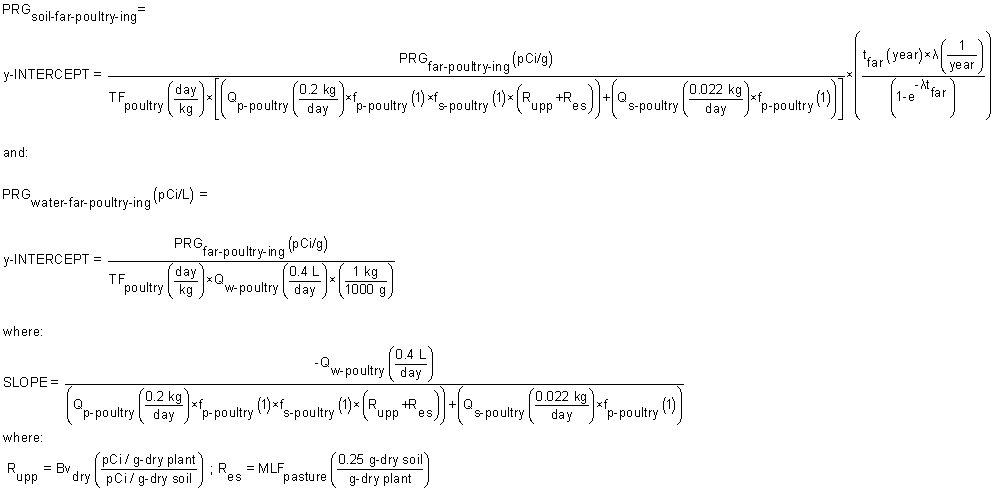
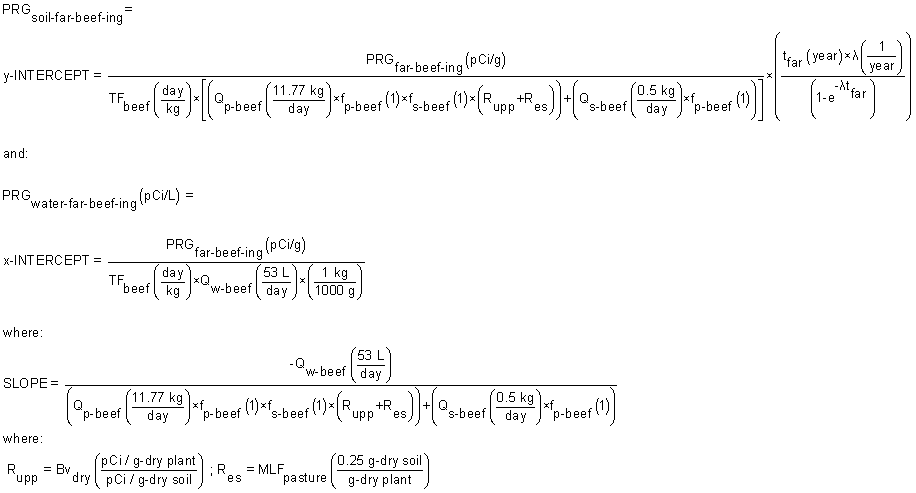
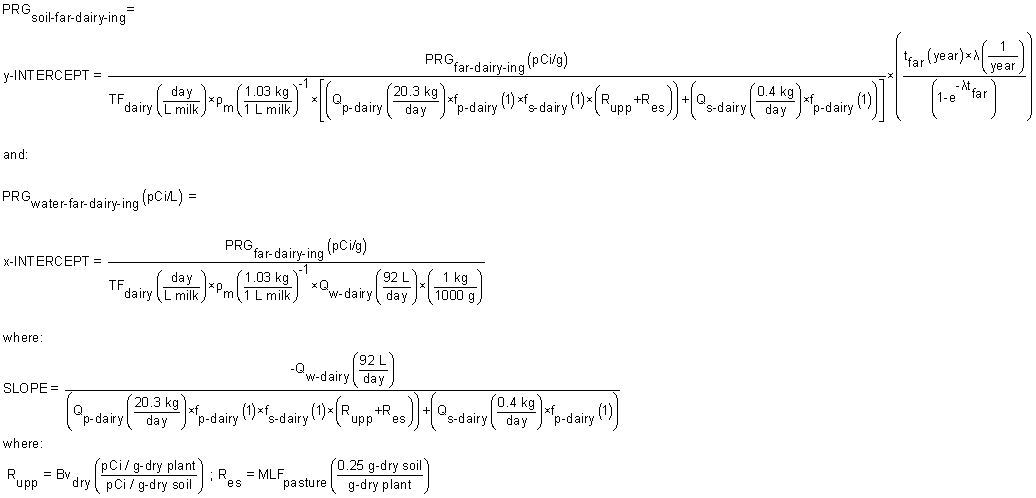
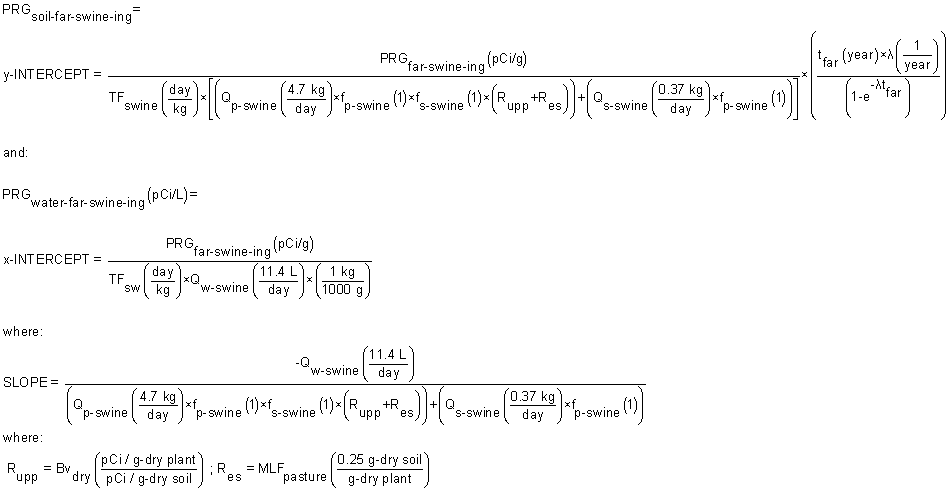
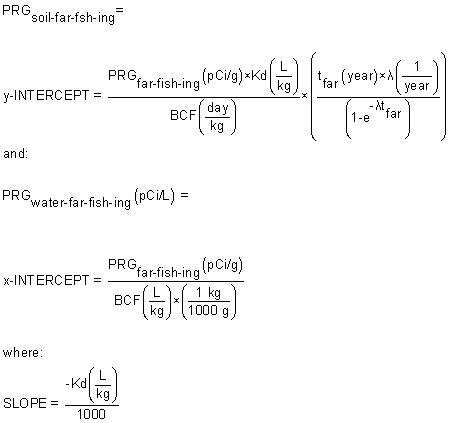
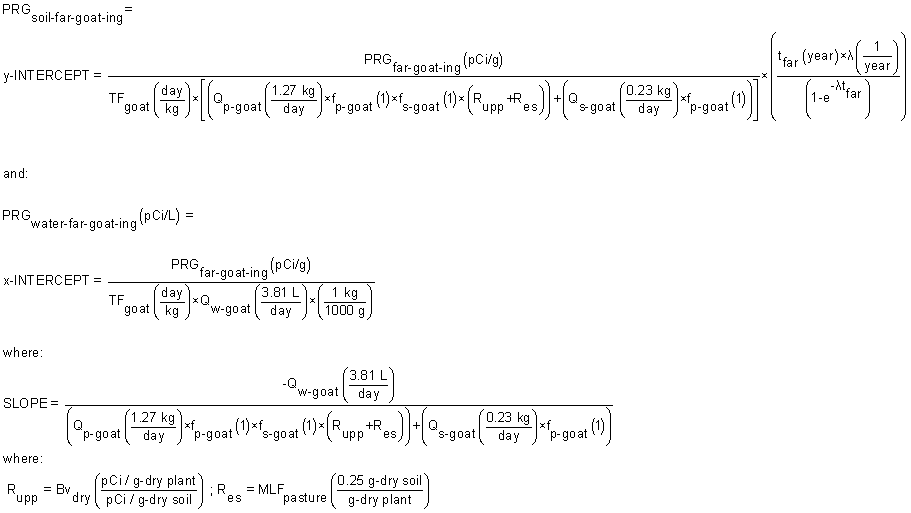
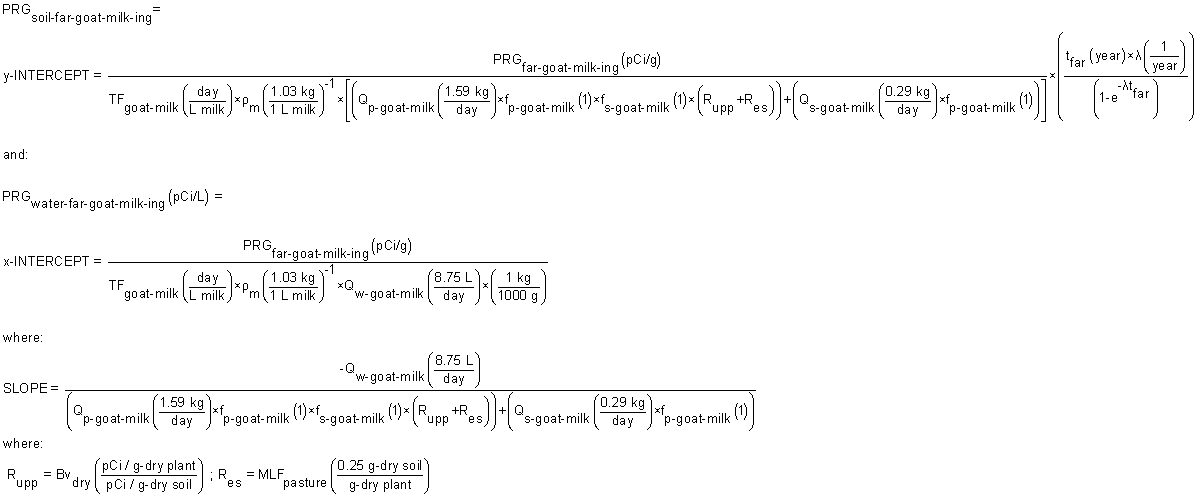
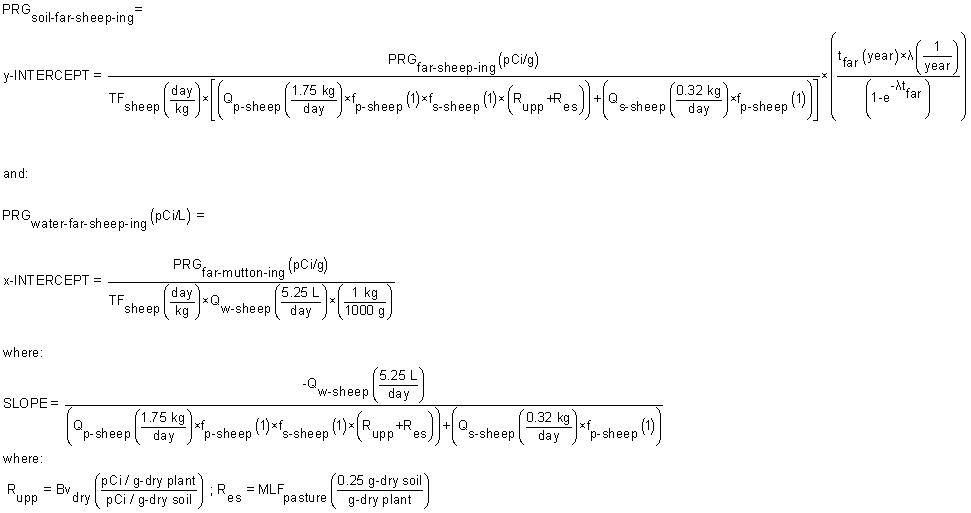
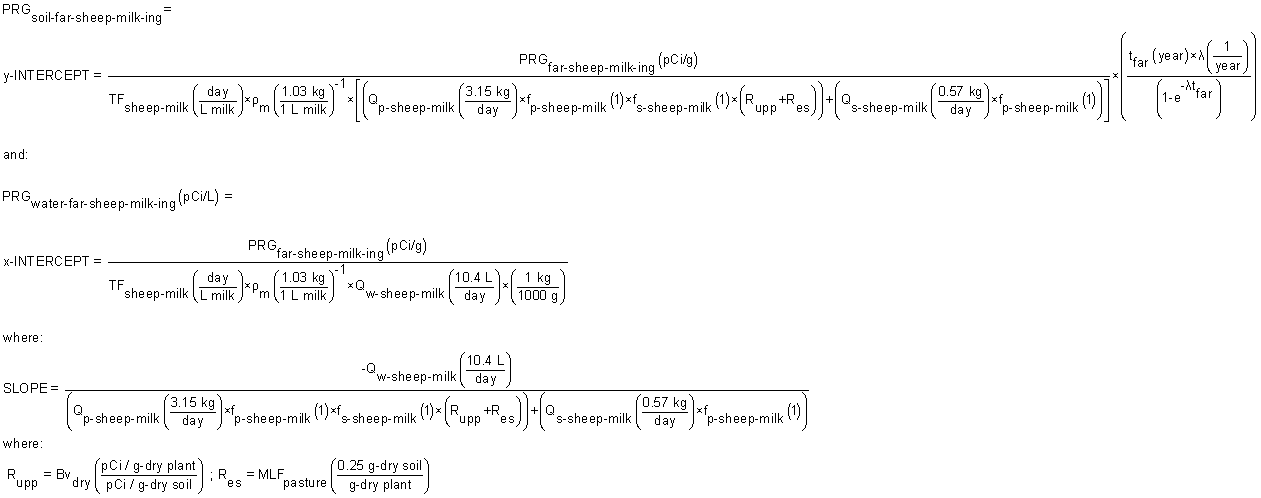
4.8.5 Farmer Air
Equations


4.9 Soil to Groundwater
Graphical Representation
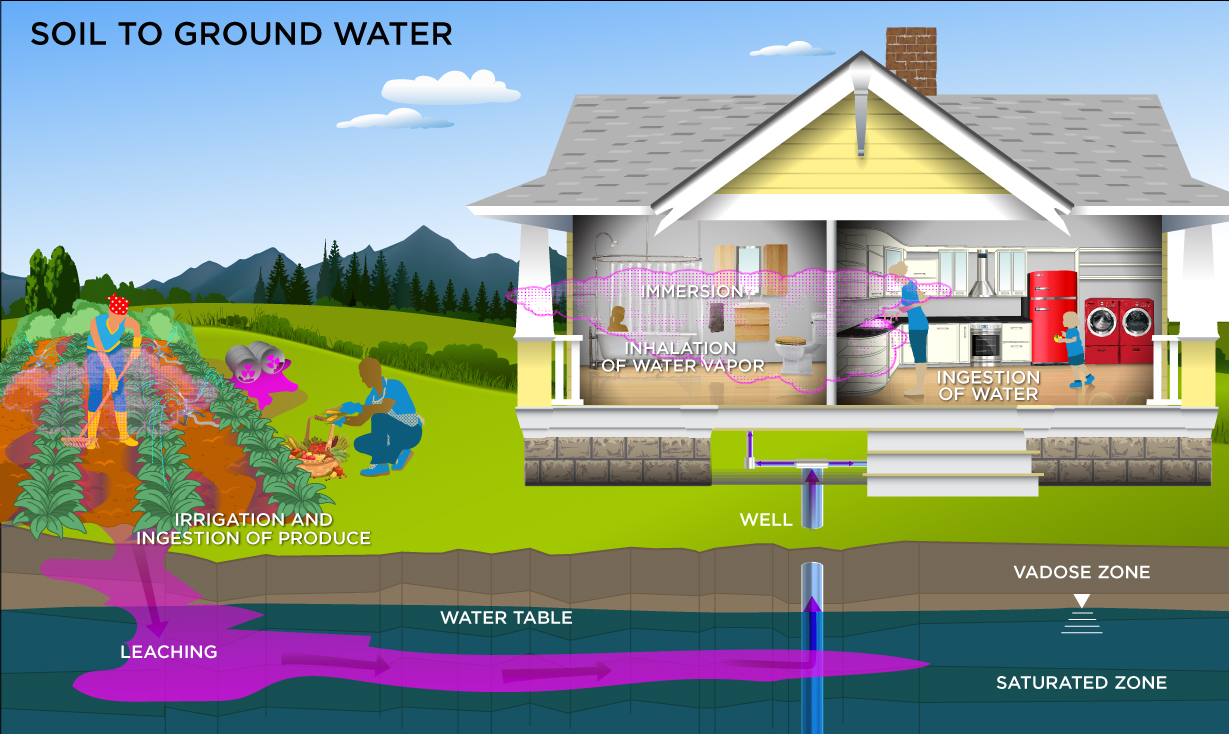
Equations
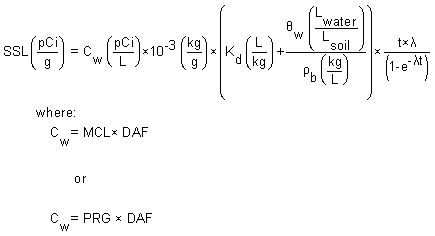
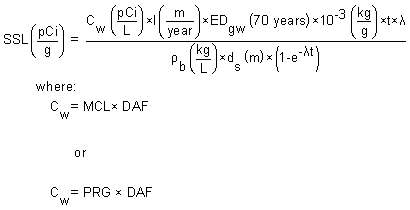
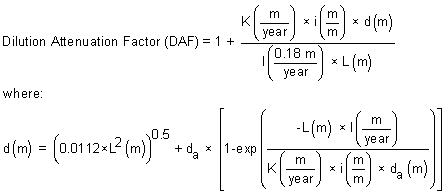
4.10 Supporting Equations and Parameter Discussion
4.10.1 Particulate Emission Factor (PEF) and Volatilization Factor (VF)
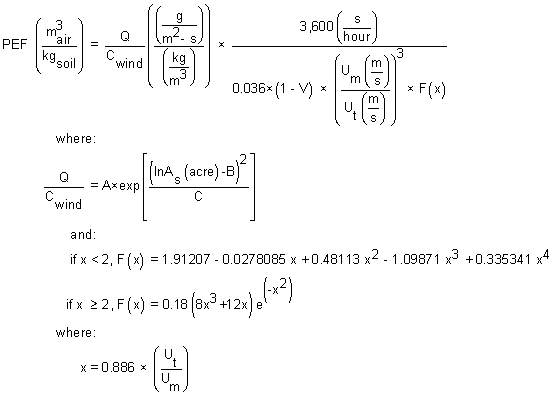
4.10.2 Standard Unpaved Road Vehicle Traffic Particulate Emission Factor (PEFsc)
W = [(20 cars x 2 tons/car) + (10 trucks x 20 tons/truck)]/30 vehicles = 8 tons
The sum of the fleet vehicle kilometers traveled during construction (∑ VKT) can be estimated based on the size of the area of surface soil contamination, assuming the configuration of the unpaved road, and the amount of vehicle traffic on the road. For example, if the area of surface soil contamination is 0.5 acres (or 2,024 m2), and one assumes that this area is configured as a square with the unpaved road segment dividing the square evenly, the road length would be equal to the square root of 2,024 m2, 45 m (or 0.045 km). Assuming that each vehicle travels the length of the road once per day, 5 days per week for a total of 6 months, the total fleet vehicle kilometers traveled would be:
∑ VKT = 30 vehicles x 0.045 km/day x (52 wks/yr / 2) x 5 days/wk = 175.5 km
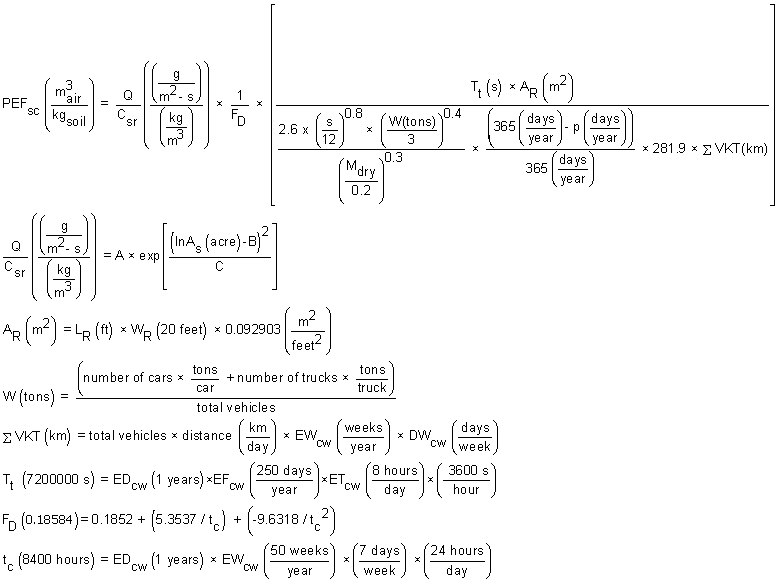
4.10.3 Other Construction Activities Particulate Emission Factor (PEF'sc)
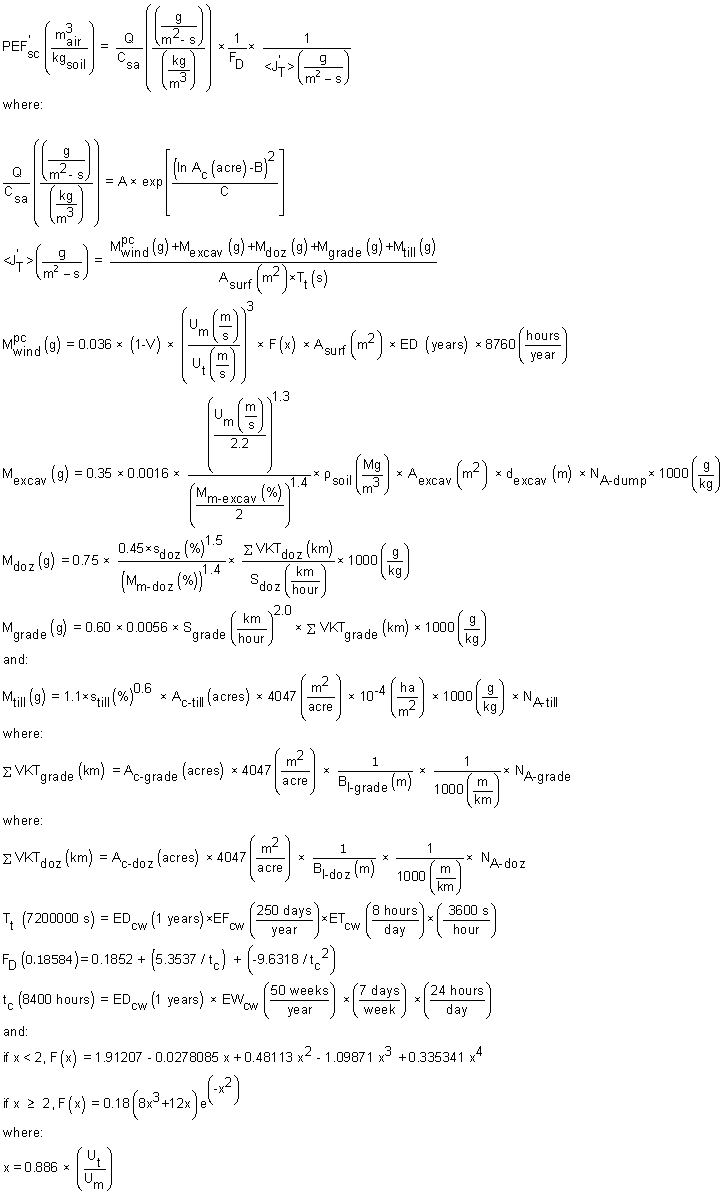
4.10.4 Radionuclide Decay Constant (λ)
4.10.5 Area Correction Factor
4.10.6 Gamma Shielding Factor
4.10.7 Using the Back-calculated to Soil and Water Graph
The back-calculated to soil and water PRG results are listed after back-calculated to soil and back-calculated to water on the results page. The graph is available for ingestion of produce and animal products and may be accessed by clicking on any highlighted blue PRG link in the image below.
Clicking on a highlighted blue back-calculated to soil and water PRG will take the user to the Farmer PRG Graphical Results page where the graph is displayed.
The x-intercept (x,0) shows where the water PRG = Target Risk (TR) and soil concentration must equal 0. The y-intercept (0,y) shows where the soil PRG = TR and the water concentration must equal 0. Any point between (x,0) and (0,y) shows a separate PRG for water and soil that will meet the TR. The slope between the water PRG and soil PRG is provided, if the user wishes to calculate another PRG that will meet the TR.
The scale of the graph has been programmed with upper bounds of 1.0E+6 pCi/g and 1.0E+6 pCi/L and lower bounds of 1.0E-10 pCi/g and 1.0E-10 pCi/L solely for presentation purposes to avoid scaling issues.
5. Recommended Default Exposure Parameters
Table 1. Recommended Default Exposure Parameters
Slope Factors
Symbol
Definition (units)
Default
Reference
SFs
Soil Ingestion Slope Factor - population (risk/pCi)
Isotope-specific
ORNL 2014c
SFsa
Soil Ingestion Slope Factor - adult only (risk/pCi)
Isotope-specific
ORNL 2014c
SFf
Food Ingestion Slope Factor (risk/pCi)
Isotope-specific
ORNL 2014c
SFw
Water Ingestion Slope Factor (risk/pCi)
Isotope-specific
ORNL 2014c
SFi
Slope Factor - inhalation (risk/pCi)
Isotope-specific
ORNL 2014c
SFext-sv
Slope Factor - external exposure (risk/yr per pCi/g)
Isotope-specific
ORNL 2014c
SFext-1cm
Slope Factor - external exposure (risk/yr per pCi/g)
Isotope-specific
ORNL 2014c
SFext-5cm
Slope Factor - external exposure (risk/yr per pCi/g)
Isotope-specific
ORNL 2014c
SFext-15cm
Slope Factor - external exposure (risk/yr per pCi/g)
Isotope-specific
ORNL 2014c
SFext-gp
Slope Factor - external exposure (risk/yr per pCi/cm2)
Isotope-specific
ORNL 2014c
SFsub
Slope Factor - submersion (risk/yr per pCi/cm3):
For use in this tool, ORNL 2014c units were converted to (risk/yr per pCi/m3)Isotope-specific
ORNL 2014c
SFimm
Slope Factor - immersion (risk/yr per pCi/L)
Isotope-specific
ORNL 2014c
Dose and
Decay Constant Variables
Symbol
Definition (units)
Default
Reference
TR
Target Risk
1 × 10⁻⁶
U.S. EPA 1991b
tw
Time - worker (years)
25
U.S. EPA 1991a (pg. 15)
tiw
Time - indoor worker (years)
25
U.S. EPA 1991a (pg. 15)
tow
Time - outdoor worker (years)
25
U.S. EPA 1991a (pg. 15)
tcw
Time - construction worker (years)
1
U.S. EPA 2002 Exhibit 5-1
tres
Time - resident (years)
26
U.S. EPA 2011a, Table 16-108; 90th percentile or current residence time.
tfar
Time - farmer (years)
40
U.S. EPA 2005 (pg. C-24/C-26)
trec
Time - recreator (years)
site-specific
site-specific
λ
decay constant = 0.693/half-life (year-1)
where 0.693 = ln(2)Isotope-specific
Developed for Radionuclide Soil Screening calculator
Miscellaneous Variables
Symbol
Definition (units)
Default
Reference
ACFext-sv
Area Correction Factor - soil volume (unitless)
Isotope-specific
ORNL 2014a
ACFext-1cm
Area Correction Factor - 1cm (unitless)
Isotope-specific
ORNL 2014a
ACFext-5cm
Area Correction Factor - 5cm (unitless)
Isotope-specific
ORNL 2014a
ACFext-15cm
Area Correction Factor - 15cm (unitless)
Isotope-specific
ORNL 2014a
ACFext-gp
Area Correction Factor - ground plane (unitless)
Isotope-specific
ORNL 2014a
GSFi
Gamma Shielding Factor - Indoor (unitless)
0.4
U.S. EPA 2000a. (pg. 2-22). U.S. EPA 2000b. (pg. 2-18)
GSFb
Gamma Shielding Factor - building (unitless)
GSFi × GSFo
Developed for Radionuclide Soil Screening calculator
GSFo-ext-sv
Gamma Shielding Factor - soil volume (unitless)
Isotope-specific
ORNL 2014a
GSFo-ext-1cm
Gamma Shielding Factor - 1cm (unitless)
Isotope-specific
ORNL 2014b
GSFo-ext-5cm
Gamma Shielding Factor - 5cm (unitless)
Isotope-specific
ORNL 2014b
GSFo-ext-15cm
Gamma Shielding Factor - 15cm (unitless)
Isotope-specific
ORNL 2014b
GSFo-ext-gp
Gamma Shielding Factor - ground plane (unitless)
Isotope-specific
ORNL 2014b
GSFa
Gamma Shielding Factor - Air (unitless)
1
Developed for Radionuclide Soil Screening calculator
CFres-produce
Produce Contaminated Fraction - resident (unitless)
1
U.S. EPA 2011, U.S. EPA 2005
CFfar-produce
Produce Contaminated Fraction - farmer (unitless)
1
U.S. EPA 2011, U.S. EPA 2005
CFfar-poultry
Poultry Contaminated Fraction - farmer (unitless)
1
Developed for Radionuclide Soil Screening calculator
CFfar-egg
Egg Contaminated Fraction - Farmer (unitless)
1
Developed for Radionuclide Soil Screening calculator
CFfar-beef
Beef Contaminated Fraction - farmer (unitless)
1
Developed for Radionuclide Soil Screening calculator
CFfar-dairy
Dairy Contaminated Fraction - farmer (unitless)
1
Developed for Radionuclide Soil Screening calculator
CFfar-swine
Swine Contaminated Fraction - farmer (unitless)
1
Developed for Radionuclide Soil Screening calculator
CFfar-fish
Fish Contaminated Fraction - farmer (unitless)
1
Developed for Radionuclide Soil Screening calculator
CFfar-sheep
Sheep Contaminated Fraction - Farmer (unitless)
1
Developed for Radionuclide Soil Screening calculator
CFfar-goat
Goat Contaminated Fraction - Farmer (unitless)
1
Developed for Radionuclide Soil Screening calculator
CFfar-sheep-milk
Sheep Milk Contaminated Fraction - Farmer (unitless)
1
Developed for Radionuclide Soil Screening calculator
CFfar-goat-milk
Goat Milk Contaminated Fraction - Farmer (unitless)
1
Developed for Radionuclide Soil Screening calculator
ρm
Density of milk (kg/L)
1.03
Milk Composition & Synthesis Resource Library
K
Andelman Volatilization Factor (L/m3)
0.5
U.S. EPA 1991b (pg. 20)
Tissue Transfer
Factors and Animal Ingestion Rates of Fodder, Water, and Soil
Symbol
Definition (units)
Default
Reference
Bvwet
Soil to Plant Transfer Factor - wet (pCi/g-fresh plant per pCi/g-dry soil)
radionuclide-specific
hierarchy selection in Section 2.4.2
climate and soil selection in 2.5.1.2
Bvdry
Soil to Plant Transfer Factor - dry (pCi/g-dry plant per pCi/g-dry soil)
radionuclide-specific
hierarchy selection in Section 2.4.2
Rupv
wet root uptake for produce multiplier (pCi/g-fresh plant per pCi/g-dry soil)
radionuclide-specific (=Bvwet)
hierarchy selection in Section 2.4.2
Rupp
dry root uptake for pasture multiplier (pCi/g-dry plant per pCi/g-dry soil)
radionuclide-specific (=Bvdry)
hierarchy selection in Section 2.4.2
Res
soil resuspension multiplier (g dry soil per g fresh plant)
=MLF (pasture or produce)
Hinton 1992
BCF
Fish Transfer Factor (L/kg)
radionuclide-specific
hierarchy selection in Section 2.4.2
TFbeef
Beef Transfer Factor (day/kg)
radionuclide-specific
hierarchy selection in Section 2.4.2
TFdairy
Dairy Transfer Factor (day/L)
radionuclide-specific
hierarchy selection in Section 2.4.2
TFswine
Swine Transfer Factor (day/kg)
radionuclide-specific
hierarchy selection in Section 2.4.2
TFpoultry
Poultry Transfer Factor (day/kg)
radionuclide-specific
hierarchy selection in Section 2.4.2
TFegg
Egg Transfer Factor (day/kg)
radionuclide-specific
hierarchy selection in Section 2.4.2
TFsheep
Sheep Transfer Factor (day/kg)
radionuclide-specific
hierarchy selection in Section 2.4.2
TFgoat
Goat Transfer Factor (day/kg)
radionuclide-specific
hierarchy selection in Section 2.4.2
TFsheep-milk
Sheep Milk Transfer Factor (day/L)
radionuclide-specific
hierarchy selection in Section 2.4.2
TFgoat-milk
Goat Milk Transfer Factor (day/L)
radionuclide-specific
hierarchy selection in Section 2.4.2
F
Irrigation Period (unitless)
0.25
Personal communication
If
Interception Fraction (unitless)
0.42
Miller, C. W. 1980
Ir
Irrigation Rate (L/m2)
3.62
Personal communication
λHL
Rate of removal from soil by harvesting or leaching (1/day)
0.000027
NCRP 1996
λi
decay of parent or daughter products (1/day)
0.693/HL (days)
NCRP 1996
λE
Effective Rate of Removal from Produce (1/day)
λi + (0.693/tw)
NCRP 1996
λB
Effective Rate of Removal from Soil (1/day)
λHL + λi
NCRP 1996
T
Translocation Factor (unitless)
1
NCRP 1996
tb
Long Term Deposition and Buildup (day)
10950
NCRP 1996
tv
Above Ground Exposure Time (day)
60
NCRP 1996
tw
Weathering Half-life (day)
14
NCRP 1996
Yv
Plant Yield - wet (kg/m2)
2
NCRP 1996
P
Area Density for Root Zone (kg/m2)
240
Hoffman, F. O., R. H. Gardner, and K. F. Eckerman. 1982; Peterson, H. T., Jr. 1983; McKone, T. E. 1994
MLFproduce
Produce Plant Mass Loading Factor (g dry soil per g fresh plant)
plant-specific
See section 2.4.3 of this guide for details
MLFpasture
Pasture Plant Mass Loading Factor (g dry soil per g dry plant)
0.25
Hinton, T. G. 1992
Qp-beef
Beef Fodder Intake Rate (kg/day)
11.77
U.S. EPA 2005 (pg. B-138)
Qp-dairy
Dairy Fodder Intake Rate (kg/day)
20.3
U.S. EPA 2005 (pg. B-145)
Qp-swine
Swine Fodder Intake Rate (kg/day)
4.7
U.S. EPA 2005 (pg. B-152)
Qp-poultry
Chicken Fodder Intake Rate (kg/day)
Duck Fodder Intake Rate (kg/day)
Turkey Fodder Intake Rate (kg/day)
Goose Fodder Intake Rate (kg/day)0.2
0.24
0.68
0.33U.S. EPA 2005 (pg. B-158/164)
NRC 1994
NRC 1994
NRC 1994
Qp-sheep
Sheep Fodder Intake Rate (kg/day)
1.75
Lyons et. al. 1999 and OMAFRA
Qp-goat
Goat Fodder Intake Rate (kg/day)
1.27
Lyons et. al. 1999
Qp-sheep-milk
Sheep Milk Fodder Intake Rate (kg/day)
3.15
Lyons et. al. 1999 and OMAFRA
Qp-goat-milk
Goat Milk Fodder Intake Rate (kg/day)
1.59
Lyons et. al. 1999 and Tarr
Qs-beef
Beef Soil Intake Rate (kg/day)
0.5
U.S. EPA 2005 (pg. B-139)
Qs-dairy
Dairy Soil Intake Rate (kg/day)
0.4
U.S. EPA 2005 (pg. B-146)
Qs-swine
Swine Soil Intake Rate (kg/day)
0.37
U.S. EPA 2005 (pg. B-153)
Qs-poultry
Chicken Soil Intake Rate (kg/day)
Duck Soil Intake Rate (kg/day)
Turkey Soil Intake Rate (kg/day)
Goose Soil Intake Rate (kg/day)0.022
0.024
0.068
0.033U.S. EPA 2005 (pg. B-159/165)
NRC 1994 (Qs is 10% of Qp)
NRC 1994 (Qs is 10% of Qp)
NRC 1994 (Qs is 10% of Qp)
Qs-sheep
Sheep Soil Intake Rate (kg/day)
0.32
Handbook of Ecotoxicology (Qs is 18% of Qp)
Qs-goat
Goat Soil Intake Rate (kg/day)
0.23
Handbook of Ecotoxicology (Qs is 18% of Qp: sheep surrogate used)
Qs-sheep-milk
Sheep Milk Soil Intake Rate (kg/day)
0.57
Handbook of Ecotoxicology (Qs is 18% of Qp)
Qs-goat-milk
Goat Milk Soil Intake Rate (kg/day)
0.29
Handbook of Ecotoxicology (Qs is 18% of Qp: sheep surrogate used)
Qw-beef
Beef Water Intake Rate (L/day)
53
U.S. EPA 1999a (pg 10-23). U.S. EPA 1997b.
Qw-dairy
Dairy Water Intake Rate (L/day)
92
U.S. EPA 1999a (pg 10-23). U.S. EPA 1997b.
Qw-swine
Swine Water Intake Rate (L/day)
11.4
NEC, Swine Nutrition Guide (pg. 19). U.S. EPA 1998 (pg B-180)
Qw-poultry
Chicken Water Intake Rate (L/day)
Duck Water Intake Rate (L/day)
Turkey Water Intake Rate (L/day)
Goose Water Intake Rate (L/day)0.4
0.48
1.36
0.66U.S. EPA 2005 (pg. B-159/165), NRC 1994 pg.15 (Qw=2×Qp)
NRC 1994 pg. 15 (Qw = 2 × Qp)
NRC 1994 pg. 15 (Qw = 2 × Qp)
NRC 1994 pg. 15 (Qw = 2 × Qp)
Qw-sheep
Sheep Water Intake Rate (L/day)
5.25
OMAFRA
Qw-goat
Goat Water Intake Rate (L/day)
3.81
Tarr
Qw-sheep-milk
Sheep Milk Water Intake Rate (L/day)
10.4
OMAFRA
Qw-goat-milk
Goat Milk Water Intake Rate (L/day)
8.75
Tarr
fp-beef
Animal On-site Fraction - beef (unitless)
1
Developed for this calculator
fp-dairy
Animal On-site Fraction - dairy (unitless)
1
Developed for this calculator
fp-swine
Animal On-site Fraction - swine (unitless)
1
Developed for this calculator
fp-poultry
Animal On-site Fraction - poultry (unitless)
1
Developed for this calculator
fp-sheep
Animal On-site Fraction - sheep (unitless)
1
Developed for this calculator
fp-goat
Animal On-site Fraction - goat (unitless)
1
Developed for this calculator
fp-sheep-milk
Animal On-site Fraction - sheep milk (unitless)
1
Developed for this calculator
fp-goat-milk
Animal On-site Fraction - goat milk (unitless)
1
Developed for this calculator
fs-beef
Fraction of Year Animal On Site - beef (unitless)
1
Developed for this calculator
fs-dairy
Fraction of Year Animal On Site - dairy (unitless)
1
Developed for this calculator
fs-swine
Fraction of Year Animal On Site - swine (unitless)
1
Developed for this calculator
fs-poultry
Fraction of Year Animal On Site - poultry (unitless)
1
Developed for this calculator
fs-sheep
Fraction of Year Animal On Site - sheep (unitless)
1
Developed for this calculator
fs-goat
Fraction of Year Animal On Site - goat (unitless)
1
Developed for this calculator
fs-sheep-milk
Fraction of Year Animal On Site - sheep milk (unitless)
1
Developed for this calculator
fs-goat-milk
Fraction of Year Animal On Site - goat milk (unitless)
1
Developed for this calculator
Irrrup
root uptake from irrigation multiplier
isotope-specific
Calculated
Irrres
resuspension from irrigation multiplier
isotope-specific
Calculated
Irrdep
aerial deposition from irrigation multiplier
isotope-specific
Calculated
Inhalation,
Ingestion, and Consumption Rates
Symbol
Definition (units)
Default
Reference
IFWres-adj
Resident Tapwater Ingestion Rate - age-adjusted (L)
19,138
Calculated using the age-adjusted intake factors equation.
IFWrec-adj
Recreator Surface Water Ingestion Fraction - age-adjusted (L)
site-specific
Calculated using the age-adjusted intake factors equation.
IRWres-a
Resident Tapwater Ingestion - adult (L/day)
2.5
U.S. EPA 2011a, Tables 3-15 and 3-33; weighted average of 90th percentile consumer-only ingestion of drinking water (birth to <6 years)
IRWres-c
Resident Tapwater Ingestion - child (L/day)
0.78
U.S. EPA 2011a, Tables 3-15 and 3-33; weighted average of 90th percentile consumer-only ingestion of drinking water (birth to <6 years)
IRWrec-a
Recreator Surface Water Ingestion Rate - adult (L/hour)
0.071
Adult upper percentile from Table 3.5 of EFH 2011
IRWrec-c
Recreator Surface Water Ingestion Rate - child (L/hour)
0.12
Child upper percentile from Table 3.5 of EFH 2011
IFAres-adj
Resident Inhalation Rate - age-adjusted (m3)
161,100
Calculated using the age-adjusted intake factors equation.
IFAfar-adj
Farmer Inhalation Fraction - age-adjusted (m3)
259,000
Calculated using the age-adjusted intake factors equation.
IFArec-adj
Recreator Inhalation Fraction - age-adjusted (m3)
site-specific
Calculated using the age-adjusted intake factors equation.
IRAres-a
Resident Inhalation Rate - adult (m3/day)
20
U.S. EPA 1991a (pg. 15)
IRAres-c
Resident Inhalation Rate - child (m3/day)
10
U.S. EPA 1997a (pg. 5-11)
DFArec-adj
Recreator Immersion Factor - age-adjusted (hours)
site-specific
U.S. EPA 1991a (pg. 15)
IRArec-a
Recreator Inhalation Rate - adult (m3/day)
20
U.S. EPA 1991a (pg. 15)
IRArec-c
Recreator Inhalation Rate - child (m3/day)
10
U.S. EPA 1997a (pg. 5-11)
IRAfar-a
Soil Inhalation Rate - adult farmer(m3/day)
20
U.S. EPA 1991a (pg. 15)
IRAfar-c
Farmer Inhalation Rate - child (m3/day)
10
U.S. EPA 1997a (pg. 5-11)
IRAiw
Indoor Worker Inhalation Rate (m3; based
on a rate of 2.5m3/hour for 24 hours)
60
U.S. EPA 1997a (pg. 5-11)
IRAow
Outdoor Worker Inhalation Rate (m3/day; based on a rate of 2.5m3/hour for 24 hours)
60
U.S. EPA 1997a (pg. 5-11)
IRAcw
Construction Worker Inhalation Rate (m3/day; based
on a rate of 2.5m3/hour for 24 hours)
60
U.S. EPA 1997a (pg. 5-11)
IRAw
Composite Worker Inhalation Rate (m3/day; based on a rate of 2.5m3/hour for 24 hours)
60
U.S. EPA 1997a (pg. 5-11)
IFSres-adj
Resident Ingestion Fraction - age-adjusted (mg)
1,120,000
Calculated using the age-adjusted intake factors equation.
IFSrec-adj
Recreator Ingestion Fraction - age-adjusted (mg)
site-specific
Calculated using the age-adjusted intake factors equation.
IFSfar-adj
Farmer Soil Ingestion Fraction - age-adjusted (mg)
1,610,000
Calculated using the age-adjusted intake factors equation.
IRSres-a
Resident Soil Ingestion Rate - adult (mg/day)
100
U.S. EPA 1991a (pg. 15)
IRSres-c
Resident Soil Ingestion Rate - child (mg/day)
200
U.S. EPA 1991a (pg. 15)
IRSrec-a
Recreator Soil Ingestion Rate - adult (mg/day)
100
U.S. EPA 1991a (pg. 15)
IRSrec-c
Recreator Soil Ingestion Rate - child (mg/day)
200
U.S. EPA 1991a (pg. 15)
IRSfar-a
Farmer Soil Ingestion Rate - adult (mg/day)
100
U.S. EPA 1991a (pg. 15)
IRSfar-c
Farmer Soil Ingestion Rate - child (mg/day)
200
U.S. EPA 1991a (pg. 15)
IRSiw
Indoor Worker Soil Ingestion Rate (mg/day)
50
U.S. EPA 2001 (pg. 4-3)
IRSow
Outdoor Worker Soil Ingestion Rate (mg/day)
100
U.S. EPA 1991a (pg. 15)
IRSw
Composite Worker Soil Ingestion Rate (mg/day)
100
U.S. EPA 1991a (pg. 15)
IRScw
Construction Worker Soil Ingestion Rate (mg/day)
330
IFres-adj
Resident Produce Ingestion Fraction - age-adjusted (g)
plant-specific
Calculated using the aged adjusted intake factors equation
IFfar-adj
Farmer Produce Ingestion Fraction - age-adjusted (g)
plant-specific
Calculated using the aged adjusted intake factors equation
IRres-a
Resident Produce Ingestion Rate - adult (g/day)
plant-specific
U.S. EPA 2011 (Table 13-10)
IRres-c
Resident Produce Ingestion Rate - child (g/day)
plant-specific
U.S. EPA 2011 (Table 13-10)
IRfar-a
Farmer Produce Ingestion Rate - adult (g/day)
plant-specific
U.S. EPA 2011 (Table 13-10)
IRfar-c
Farmer Produce Ingestion Rate - child (g/day)
plant-specific
U.S. EPA 2011 (Table 13-10)
IRFres
Resident Fish Ingestion Rate (g/day)
54
U.S. EPA 1991a (page 15)
IFFIfar-adj
Farmer Fish Ingestion Fraction - age-adjusted (g)
10,018,960
Calculated using the aged adjusted intake factors equation
IRFIfar-a
Farmer Fish Ingestion Rate - adult (g/day)
831.8
U.S. EPA 2011 (Table 13-20)
IRFIfar-c
Farmer Fish Ingestion Rate - child (g/day)
57.4
U.S. EPA 2011 (Table 13-20)
IFDfar-adj
Farmer Dairy Ingestion Fraction - age-adjusted (g)
10,138,030
Calculated using the aged adjusted intake factors equation
IRDfar-a
Farmer Dairy Ingestion Rate - adult (g/day)
676.4
U.S. EPA 2011 (Table 13-25)
IRDfar-c
Farmer Dairy Ingestion Rate - child (g/day)
994.7
U.S. EPA 2011 (Table 13-25)
IFBfar-adj
Farmer Beef Ingestion Fraction - age-adjusted (g)
2,098,950
Calculated using the aged adjusted intake factors equation
IRBfar-a
Farmer Beef Ingestion Rate - adult (g/day)
165.3
U.S. EPA 2011 (Table 13-33)
IRBfar-c
Farmer Beef Ingestion Rate - child (g/day)
62.8
U.S. EPA 2011 (Table 13-33)
IFSWfar-adj
Farmer Swine Ingestion Fraction - age-adjusted (g)
1,171,520
Calculated using the aged adjusted intake factors equation
IRSWfar-a
Farmer Swine Ingestion Rate - adult (g/day)
92.5
U.S. EPA 2011 (Table 13-51)
IRSWfar-c
Farmer Swine Ingestion Rate - child (g/day)
33.7
U.S. EPA 2011 (Table 13-51)
IFEfar-adj
Farmer Egg Ingestion Rate - age-adjusted (g)
775,810
Calculated using the aged adjusted intake factors equation
IREfar-a
Farmer Egg Ingestion Rate - adult (g/day)
59.6
U.S. EPA 2011 (Table 13-40)
IREfar-c
Farmer Egg Ingestion Rate - child (g/day)
31.7
U.S. EPA 2011 (Table 13-40)
IFPfar-adj
Farmer Poultry Ingestion Fraction - age-adjusted (g)
1,376,550
Calculated using the aged adjusted intake factors equation
IRPfar-a
Farmer Poultry Ingestion Rate - adult (g/day)
107.4
U.S. EPA 2011 (Table 13-52)
IRPfar-c
Farmer Poultry Ingestion Rate - child (g/day)
46.9
U.S. EPA 2011 (Table 13-52)
Exposure Frequency, Exposure Duration, and Exposure Time Variables
Symbol
Definition (units)
Default
Reference
EFres
Resident Exposure Frequency - (days/year)
350
U.S. EPA 1991a (pg. 15)
EFres-c
Resident Exposure Frequency - child (days/year)
350
U.S. EPA 1991a (pg. 15)
EFres-a
Resident Exposure Frequency - adult (days/year)
350
U.S. EPA 1991a (pg. 15)
EFrec
Recreator Exposure Frequency - (days/year)
site-specific
U.S. EPA 1991a (pg. 15)
EFrec-c
Recreator Exposure Frequency - child (days/year)
site-specific
U.S. EPA 1991a (pg. 15)
EFrec-a
Recreator Exposure Frequency - adult (days/year)
site-specific
U.S. EPA 1991a (pg. 15)
EFfar
Farmer Exposure Frequency (days/year)
350
U.S. EPA 1991a (pg. 15)
EFw
Composite Worker Exposure Frequency (days/year)
250
U.S. EPA 1991a (pg. 15)
EFiw
Indoor Worker Exposure Frequency (days/year)
250
U.S. EPA 1991a (pg. 15)
EFow
Outdoor Worker Exposure Frequency (days/year)
225
U.S. EPA 1991a (pg. 15)
EFcw
Construction Worker Exposure Frequency (days/year)
250
U.S. EPA 2002 Exhibit 5-1
EWcw
Construction Worker Exposure Frequency (weeks/year)
50
U.S. EPA 2002 Exhibit 5-1
DWcw
Construction Worker Exposure Frequency (days/week)
5
U.S. EPA 2002 Exhibit 5-1
EDres
Resident Exposure Duration (years)
26
U.S. EPA 2011a, Table 16-108; 90th percentile or current residence time.
EDres-a
Resident Exposure Duration - adult (years)
20
EDres (26 years) - EDres-c (6 years)
EDres-c
Resident Exposure Duration - child (years)
6
U.S. EPA 1991a, Pages 6 and 15
EDrec
Recreator Exposure Duration (years)
site-specific
U.S. EPA 2011a, Table 16-108; 90th percentile or current residence time.
EVrec-a
Number of bathing events per day - adult recreator (events/day)
site-specific
-
EVrec-c
Number of bathing events per day - child recreator (events/day)
site-specific
U.S. EPA 1991a, Pages 6 and 15
EVres-a
Number of bathing events per day - adult resident (events/day)
1
EVres-c
Number of bathing events per day - child resident (events/day)
1
EDrec-a
Recreator Exposure Duration - adult (years)
site-specific
-
EDrec-c
Recreator Exposure Duration - child (years)
site-specific
U.S. EPA 1991a, Pages 6 and 15
EDfar
Farmer Exposure Duration (years)
40
U.S. EPA 2005 (Table 6-3)
EDfar-a
Farmer Exposure Duration - adult (years)
34
U.S. EPA 1994a
EDfar-c
Farmer Exposure Duration - child (years)
6
U.S. EPA 2005 (Table 6-3)
EDw
Composite Exposure Duration (years)
25
U.S. EPA 1991a (pg. 15)
EDow
Outdoor Worker Exposure Duration (years)
25
U.S. EPA 1991a (pg. 15)
EDiw
Indoor Worker Exposure Duration (years)
25
U.S. EPA 1991a (pg. 15)
EDcw
Construction Worker Exposure Duration (years)
1
U.S. EPA 2002 Exhibit 5-1
ETiw
Indoor Worker Exposure Time (hours/day)
8
Eight Hours per 24 hour Day
ETow
Outdoor Worker Exposure Time (hours/day)
8
Eight Hours per 24 hour Day
ETw
Composite Worker Exposure Time (hours/day)
8
Eight Hours per 24 hour Day
ETcw
Construction Worker Exposure Time (hours/day)
8
Eight Hours per 24 hour Day
ETres
Resident Exposure Time (hours/day)
24
24 Hours per 24 hour Day
ETrec-a
Recreator Exposure Time - adult (hours/day)
site-specific
ETrec-c
Recreator Exposure Time - child (hours/day)
site-specific
ETrec
Recreator Exposure Time (hours/day)
site-specific
ETres-i
Resident Exposure Time - indoor (hours/day)
16.416
U.S. EPA 2011 (Table 16-16 50th%)
ETres-o
Resident Exposure Time - outdoor (hours/day)
1.752
U.S. EPA 2011 (Table 16-20 50th%))
ETfar
Farmer Exposure Time (hours/day)
24
24 Hours per 24 hour Day
ETfar-i
Farmer Exposure Time - indoor (hours/day)
10.0
1440 hrs/day - (ETf-o + ETf-a)
ETfar-a
Farmer Exposure Time - away (hours/day)
1.83
U.S. EPA 2011 (Tables 16-20 and 16-24 total of time in vehicles, near vehicles and outdoors other than near residence 25th%)
ETfar-o
Farmer Exposure Time - outdoor (hours/day)
12.167
U.S. EPA 2011 (Table 16-20 95th%))
Soil to Groundwater SSL Factor Variables
Symbol
Definition (units)
Default
Reference
Cw
Target soil leachate concentration (pCi/L)
nonzero MCL or RSL × DAF
U.S. EPA. 2002 Equation 4-14
DAF
Dilution attenuation factor (unitless)
1 (or site-specific)
U.S. EPA. 2002 Equation 4-11
EDgw
Exposure duration
70
U.S. EPA. 2002 Equation 4-14
I
Infiltration Rate (m/year)
0.18
U.S. EPA. 2002 Equation 4-11
L
source length parallel to ground water flow (m)
site-specific
U.S. EPA. 2002 Equation 4-11
i
hydraulic gradient (m/m)
site-specific
U.S. EPA. 2002 Equation 4-11
K
aquifer hydraulic conductivity (m/year)
site-specific
U.S. EPA. 2002 Equation 4-11
θw
water-filled soil porosity (Lwater/Lsoil)
0.3
U.S. EPA. 2002 Equation 4-10
θa
air-filled soil porosity (Lair/Lsoil)
= n-θw
U.S. EPA. 2002 Equation 4-10
n
total soil porosity(Lpore/Lsoil)
= 1-(ρb/ρs)
U.S. EPA. 2002 Equation 4-10
ρs
soil particle density (Kg/L)
2.65
U.S. EPA. 2002 Equation 4-10
ρb
dry soil bulk density (kg/L)
1.5
U.S. EPA. 2002 Equation 4-10
Kd
soil-water partition coefficient (L/kg)
= Koc*foc for organics
U.S. EPA. 2002 Equation 4-10
da
aquifer thickness (m)
site-specific
U.S. EPA. 2002 Equation 4-10
ds
depth of source (m)
site-specific
U.S. EPA. 2002 Equation 4-10
d
mixing zone depth (m)
site-specific
U.S. EPA. 2002 Equation 4-12
Wind Particulate Emission Factor Variables
Symbol
Definition (units)
Default
Reference
PEFw
Particulate Emission Factor - Minneapolis (m3/kg)
1.36 x 10⁹(region-specific)
U.S. EPA 2002 Exhibit D-2
Q/Cwind
Inverse of the Mean Concentration at the Center of a 0.5-Acre-Square Source (g/m2-s per kg/m3)
93.77 (region-specific)
U.S. EPA 2002 Exhibit D-2
V
Fraction of Vegetative Cover (unitless)
0.5
U.S. EPA. 2002 Equation 4-5
Um
Mean Annual Wind Speed (m/s)
4.69
U.S. EPA. 1996, Appendix D Table 2
Ut
Equivalent Threshold Value of Wind Speed at 7m (m/s)
11.32
U.S. EPA. 1996, Appendix D Table 2
F(x)
Function Dependent on 0.886 × (Ut/Um) (unitless)
0.194
U.S. EPA. 1996, Appendix D Table 2
A
Dispersion constant unitless
PEF and region-specific
U.S. EPA 2002 Exhibit D-2
As
Areal extent of the site or contamination (acres)
0.5 (range 0.5 to 500 )
U.S. EPA 2002 Exhibit D-2
B
Dispersion constant unitless
PEF and region-specific
U.S. EPA 2002 Exhibit D-2
C
Dispersion constant unitless
PEF and region-specific
U.S. EPA 2002 Exhibit D-2
Mechanical Particulate Emission Factor Variables from Standard Unpaved Road Vehicle Traffic
Symbol
Definition (units)
Default
Reference
PEFsc
Particulate Emission Factor - subchronic (m3/kg)
(site-specific)
U.S. EPA 2002 Equation 5-5
Q/Csr
Inverse of the ratio of the 1-h geometric mean concentration to the emission flux along a straight road segment bisecting a square site (g/m2-s per kg/m3)
23.02 (for 0.5 acre site)
U.S. EPA 2002 Equation 5-5
FD
Dispersion correction factor (unitless)
0.185
U.S. EPA 2002 Equation E-16
T
Total time over which construction occurs (s)
site-specific
U.S. EPA 2002 Equation 5-5
AR
Surface area of contaminated road segment (m2)
(AR = LR x WR x 0.092903m2 /ft2 )
U.S. EPA 2002 Equation 5-5
LR
Length of road segment (ft)
Site-specific
U.S. EPA 2002 Equation 5-5
WR
Width of road segment (ft)
20
U.S. EPA 2002 Equation E-18
W
Mean vehicle weight (tons)
(number of cars x tons/car + number of trucks x tons/truck) / total vehicles)
U.S. EPA 2002 Equation 5-5
p
Number of days with at least 0.01 inches of precipitation (days/year)
Site-specific
U.S. EPA 2002 Exhibit 5-2
∑VKT
Sum of fleet vehicle kilometers traveled during the exposure duration (km)
∑VKT = total vehicles x distance (km/day) x frequency (weeks/year) x (days/year)
U.S. EPA 2002 Equation 5-5
A
Dispersion constant unitless
12.9351
U.S. EPA 2002 Equation 5-6
As
Areal extent of site surface soil contamination (acres)
0.5 (range 0.5 to 500 )
U.S. EPA 2002 Equation 5-6
B
Dispersion constant unitless
5.7383
U.S. EPA 2002 Equation 5-6
C
Dispersion constant unitless
71.7711
U.S. EPA 2002 Equation 5-6
Mechanical Particulate Emission Factor Variables from Other Construction Activities
Symbol
Definition (units)
Default
Reference
PEF'sc
Particulate Emission Factor - subchronic (m3/kg)
(site-specific)
U.S. EPA 2002 Equation E-26
Q/Csa
Inverse of the ratio of the 1-h. geometric mean air
concentration and the emission flux at the center of the square emission source (g/m2-s per kg/m3)
Site-specific
U.S. EPA 2002 Equation E-15
FD
Dispersion correction factor (unitless)
Site-specific
U.S. EPA 2002 Equation E-16
A
Dispersion constant unitless
2.4538
U.S. EPA 2002 Equation E-15
B
Dispersion constant unitless
17.5660
U.S. EPA 2002 Equation E-15
C
Dispersion constant unitless
189.0426
U.S. EPA 2002 Equation E-15
As
Areal extent of site surface soil contamination (acres)
(range 0.5 to 500)
U.S. EPA 2002 Equation E-15
J'T (g/m2-s)
Total time-averaged PM10 unit emission flux for construction activities other than traffic on unpaved roads
Site-specific
U.S. EPA 2002 Equation E-25
MPCwind
Unit mass emitted from wind erosion (g)
site-specific
U.S. EPA 2002 Equation E-20
V
Fraction of Vegetative Cover (unitless)
0
U.S. EPA 2002 Equation E-20
Um
Mean Annual Wind Speed (m/s)
4.69
U.S. EPA. 1996, Appendix D Table 2
Ut
Equivalent Threshold Value of Wind Speed at 7m (m/s)
11.32
U.S. EPA. 1996, Appendix D Table 2
F(x)
Function Dependent on 0.886 × (Ut/Um) (unitless)
0.194
U.S. EPA. 1996, Appendix D Table 2
Asurf
Areal extent of site surface soil contamination (m2)
(range 0.5 to 500)
U.S. EPA 2002 Equation E-20
ED
Exposure duration (years)
Site-specific
U.S. EPA 2002 Equation E-20
Mexcav
Unit mass emitted from excavation soil dumping (g)
site-specific
U.S. EPA 2002 Equation E-21
0.35
PM10 particle size multiplier (unitless)
0.35
U.S. EPA 2002 Equation E-21
Mm-excav
Gravimetric soil moisture content (%)
12 (mean value for municipal landfill cover)
U.S. EPA 2002 Equation E-21
ρsoil
In situ soil density (includes water) (Mg/m3)
1.68
U.S. EPA 2002 Equation E-21
Aexcav
Areal extent of excavation (m2)
(range 0.5 to 500)
U.S. EPA 2002 Equation E-21
dexcav
Average depth of excavation (m)
Site-specific
U.S. EPA 2002 Equation E-21
NA-dump
Number of times soil is dumped (unitless)
2
U.S. EPA 2002 Equation E-21
Mdoz
Unit mass emitted from dozing operations (g)
site-specific
U.S. EPA 2002 Equation E-22
0.75
PM10 scaling factor (unitless)
0.75
U.S. EPA 2002 Equation E-22
sdoz
Soil silt content (%)
6.9
U.S. EPA 2002 Equation E-22
Mm-doz
Gravimetric soil moisture content (%)
7.9 (mean value for overburden)
U.S. EPA 2002 Equation E-22
∑VKTdoz
Sum of dozing kilometers traveled (km)
Site-specific
U.S. EPA 2002 Equation E-22
Sdoz
Average dozing speed (kph)
11.4 (mean value for graders)
U.S. EPA 2002 Equation E-22
NA-doz
Number of times site is dozed (unitless)
Site-specific
U.S. EPA 2002 Equation E-22
Bd
Dozer blade length (m)
Site-specific
U.S. EPA 2002 Page E-28
Mgrade
Unit mass emitted from grading operations (g)
site-specific
U.S. EPA 2002 Equation E-23
0.60
PM10 scaling factor (unitless)
0.60
U.S. EPA 2002 Equation E-23
∑VKTgrade
Sum of grading kilometers traveled (km)
U.S. EPA 2002 Equation E-23
Sgrade
Average grading speed (kph)
11.4 (mean value for graders)
U.S. EPA 2002 Equation E-23
NA-grade
Number of times site is graded (unitless)
Site-specific
U.S. EPA 2002 Equation E-23
Bg
Grader blade length (m)
Site-specific
U.S. EPA 2002 Page E-28
Mtill
Unit mass emitted from tilling operations (g)
site-specific
U.S. EPA 2002 Equation E-24
still
Soil silt content (%)
18
U.S. EPA 2002 Equation E-24
Ac-till
Areal extent of tilling (acres)
Site-specific
U.S. EPA 2002 Equation E-24
Ac-grade
Areal extent of grading (acres)
Site-specific
Necessary to solve ∑VKTgrade in U.S. EPA 2002 Equation E-23
Ac-doz
Areal extent of dozing (acres)
Site-specific
Necessary to solve ∑VKTdoz in U.S. EPA 2002 Equation E-22
NA-till
Number of times soil is tilled (unitless)
2
U.S. EPA 2002 Equation E-24
6. References
ANL (2001). User's Manual for RESRAD Version 6. Argonne National Laboratory, Argonne, IL. ANL/EAD-4
AMEC (2014). Uptake of Gaseous Carbon-14 in the Biosphere: Development of an Assessment Model. AMEC/004041/007, Issue 2.
Calabrese E.J., Barnes R., Stanek III E.J., Pastides H., Gilbert CE, Veneman P., Wang XR, Lasztity A., and Kostecki P.T. (1989); How much soil do young children ingest: an epidemiologic study. Regul Toxicol Pharmacol: 10(2):123-137.
Davis, S; Waller, P; Buschbom, R; Ballou, J; White, P. (1990). Quantitative estimates of soil ingestion in normal children between the ages of 2 and 7 years: Population-based estimates using aluminum, silicon, and titanium as soil tracer elements. Arch Environ Health 45: 112-122.
Environment Agency (E.A.) (2006). Initial radiological assessment methodology - part 2 methods and input data. United Kingdom. SC030162/SR2.
Environment Agency (E.A.) (2009). Updated technical background to the CLEA model. United Kingdom. SC050021/SR3. pg. 97 and pg. 100.
Etnier 1980. Till, J. E., H. R. Meyer, E. L. Etnier, E. S. Bomar, R. D. Gentry, G. G. Killough, P. S. Rohwer, V. J. Tennery, and C. C. Travis Tritium-An Analysis of Key Environmental and Dosimetric Questions. ORNL/TM-6990. pg 15.
Hinton, T. G. 1992. Contamination of plants by resuspension: a review, with critique of measurement methods. Sci. Total Environ. 121:171-193
Hoffman, David J.; Rattner, Barnett A.; Burton, G. Allen jr.; Cairns, John jr. 2003. Handbook of Ecotoxicology: Second Edition. Lewis Publishers.
IAEA 1994. Handbook of Parameter Values for the Prediction of Radionuclide Transfer in Temperate Environments. International Atomic Energy Agency. TRS-364
IAEA 2009. Quantification of Radionuclide Transfer in Terrestrial and Freshwater Environments for Radiological Assessments. International Atomic Energy Agency. TECDOC1616.
IAEA 2010. Technical Report Series No. 472: Handbook of Parameter Values for the Prediction of Radionuclide Transfer in Terrestrial and Freshwater Environments. International Atomic Energy Agency. TRS-472
ICRP 2008. Nuclear Decay Data for Dosimetric Calculations. ICRP Publication 107. Ann. ICRP 38 (3).
Lyons, Robert K.; Machen, Rick; Forbes, T.D.A. 1999 Understanding Forage Intake in Range Animals AgriLIFE Extension. Texas A&M.
Lugo, A. E.; Brown, S.L.; Dodson, R.; Smith, T.S.; and Shugart, H.H. (1999); The Holdridge life zones of the conterminous United States in relation to ecosystem mapping ; Journal of Biogeography, 26, 1025-1038
MILLER Ch. W. (1980): An analysis of measured values for the fraction of a radiocative aerosol intercepted by vegetation. Health Physics, 38: 705 - 712.
NCRP (1996). Screening Models for Releases of Radionuclides to Atmosphere, Surface Water, and Ground, Vols. 1 and 2, NCRP Report No. 123. National Council on Radiation Protection and Measurements. http://www.ncrp.com/rpt123.html
NEC. Swine Nutrition Guide. Cooperative Extension Service / South Dakota State University and University of Nebraska / U.S. Department of Agriculture. Nebraska Cooperative Extension EC 95-273-C.
The pig water ingestion numbers are derived from the USDA "Swine Nutrition Guide" and the EPA Human Health Risk Assessment Protocol for Hazardous Waste Combustion Facilities, found here. USDA assumes a pig consumes 1/4 to 1/3 gallons of water for every pound of dry feed. The midpoint of this range (7/24 gallons of water per 1 lbs. of dry feed) was used with the default dry feed, (4.7 kg) from the U.S. EPA, to come up with 3 gallons (11.4 L) per day default water intake.
NRC 1994. Nutrient Requirements of Poultry: Ninth Revised Edition. Washington, DC: The National Academies Press, 1994.
OMAFRA (2015). Water Requirements of Livestock. Order Number 07-023. July, 2015.
ORNL (2014a). Area Correction Factors for Contaminated Soil for Use in Risk and Dose Assessment Models and appendix. Center for Radiation Protection Knowledge. September 2014.
ORNL (2014b). Gamma Shielding Factors for Soil Covered Contamination for Use in Risk and Dose Assessment Models and appendix. Center for Radiation Protection Knowledge. September 2014.
ORNL (2014c). Calculation of Slope Factors and Dose Coefficients and appendix. Center for Radiation Protection Knowledge. September 2014.
ORNL (2016). Biota Modeling in EPA's Preliminary Remediation Goal and Dose Compliance Concentration Calculators for Use in EPA Superfund Risk Assessment: Explanation of Intake Rate Derivation, Transfer Factor Compilation, and Mass Loading Factor Sources Center for Radiation Protection Knowledge. November 2016.
Pinder, J. E. ,. I., and K. W. McLeod. (1989). Mass loading of soil particles on plant surfaces, Health Phys. 57:935-942.
Tarr, Brian. Guidelines to Feeding and Management of Dairy Goats Nutrifax. Shur Gain.
U.S. EPA. (1988). Limiting Values of Radionuclide Intake and Air Concentration and Dose Conversion Factors for Inhalation, Submersion, and Ingestion. Federal Guidance Report No. 11. Office of Radiation Programs, Washington, DC. EPA-520/1-88-020. http://www.epa.gov/radiation/federal/index.html
U.S. EPA (1989). U.S. Environmental Protection Agency (U.S. EPA). Risk assessment guidance for Superfund. Volume I: Human health evaluation manual (Part A). Interim Final. Office of Emergency and Remedial Response. EPA/540/1-89/002.
U.S. EPA (1990). Interim Final Methodology for Assessing Health Risks Associated with Indirect Exposure to Combustor Emissions. Environmental Criteria and Assessment Office. ORD. EPA-600-90-003. January.
U.S. EPA (1991a). U.S. Environmental Protection Agency (U.S. EPA). Human health evaluation manual, supplemental guidance: "Standard default exposure factors". OSWER Directive 9285.6-03.
U.S. EPA (1991b). Risk Assessment Guidance for Superfund, Volume I: Human Health Evaluation Manual (Part B, Development of Risk-Based Preliminary Remediation Goals). Office of Emergency and Remedial Response. EPA/540/R-92/003. December 1991
U.S. EPA. (1993). External Exposure to Radionuclides in Air, Water, and Soil. Federal Guidance Report No. 12. Office of Radiation and Indoor Air, Washington, DC. EPA 402-R-93-081. http://www.epa.gov/radiation/federal/index.html
U.S. EPA. (1994a). Estimating Exposure to Dioxin-like Components - Volume III: Site-Specific Assessment Procedure. Review Draft. Office of Research and Development. Washington D.C. EPA/600/6-88/005Cc. June. (Also see U.S. EPA. 1994c for direct link to Table) http://cfpub.epa.gov/ncea/cfm/recordisplay.cfm?deid=34762
U.S. EPA (1994b). Radiation Site Cleanup Regulations: Technical Support Documents for the Development of Radiation Cleanup Levels for Soil - Review Draft. Office of Radiation and Indoor Air, Washington, DC. EPA 402-R-96-011A. PDF document View Appendix C here.
U.S. EPA. (1994c). Revised Draft Guidance for Performing Screening Level Risk Analyses at Combustion Facilities Burning Hazardous Wastes. Attachment C, Draft Exposure Assessment Guidance for RCRA Hazardous Waste Combustion Facilities. Office of Emergency and Remedial Response. Office of Solid Waste. December 14. http://www.epa.gov/osw/hazard/tsd/td/combust/finalmact/ssra/05hhrapapc.pdf
U.S. EPA. (1996a). Soil Screening Guidance: User's Guide. Office of Emergency and Remedial Response. Washington, DC. OSWER No. 9355.4-23 http://www.epa.gov/superfund/health/conmedia/soil/index.htm
U.S. EPA. (1996b). Soil Screening Guidance: Technical Background Document. Office of Emergency and Remedial Response. Washington, DC. OSWER No. 9355.4-17A http://www.epa.gov/superfund/health/conmedia/soil/index.htm
U.S. EPA. (1997a). Exposure Factors Handbook. Office of Research and Development, Washington, DC. EPA/600/P-95/002Fa.
U.S. EPA. (1997b). Parameter Guidance Document. National Center for Environmental Assessment, NCEA-0238.
U.S. EPA. (1998). Human Health Risk Assessment Protocol for Hazardous Waste Combustion Facilities. Office of Solid Waste, Washington, DC. EPA530-D-98-001A. A secure PDF can be downloaded here.
U.S. EPA. (1999a). Data Collection for the Hazardous Waste Identification Rule. Office of Solid Waste, Washington, DC. http://www.epa.gov/osw/hazard/wastetypes/wasteid/hwirwste/risk.htm The section on cattle fodder, soil and water intakes is here.
U.S. EPA (1999b). Volume II, "Review of Geochemistry and Available Kd Values for Cadmium, Cesium, Chromium, Lead, Plutonium, Radon, Strontium, Thorium, Tritium (3H), and Uranium. Office of Radiation and Indoor Air. Washington, DC. EPA 402-R-99-004B, August 1999. http://www.epa.gov/cgi-bin/claritgw?op-Display&document=clserv:OAR:0232;&rank=4&template=epa
U.S. EPA (1999c). Cancer Risk Coefficients for Environmental Exposure to Radionuclides. Federal Guidance Report No. 13. Office of Radiation and Indoor Air. EPA 402-R-99-001. September 1999. http://www.epa.gov/radiation/federal/index.html
U.S. EPA. (2000a). Soil Screening Guidance for Radionuclides: User's Guide. Office of Emergency and Remedial Response and Office of Radiation and Indoor Air. Washington, DC. OSWER No. 9355.4-16A http://www.epa.gov/superfund/health/contaminants/radiation/radssg.htm
U.S. EPA. (2000b). Soil Screening Guidance for Radionuclides: Technical Background Document. Office of Emergency and Remedial Response and Office of Radiation and Indoor Air. Washington, DC. OSWER No. 9355.4-16 http://www.epa.gov/superfund/health/contaminants/radiation/radssg.htm
U.S. EPA (2002). Role of Background in the CERCLA Cleanup Program. Office of Solid Waste and Emergency Response, April 26, 2002, OSWER 9285.6-07P
U.S. EPA (2002). Supplemental Guidance for Developing Soil Screening Levels for Superfund Sites. OSWER 9355.4-24. December 2002. http://www.epa.gov/superfund/health/conmedia/soil/index.htm
U.S. EPA (2002). Simulating Transport in the Unsaturated Zone: Evaluation and Sensitivity Analyses of Select Computer Models.
U.S. EPA. (2005). Human Health Risk Assessment Protocol for Hazardous Waste Combustion Facilities. Office of Solid Waste, Washington, DC. http://www.epa.gov/osw/hazard/tsd/td/combust/risk.htm. The pdf is available here.
U.S. EPA. (2011). Exposure Factors Handbook 2011 Edition (Final). National Center for Environmental Assessment, Office of Research and Development. Washington D.C.
van Wijnen J.H., Clausing P., and Brunekreef B. (1990); Estimated soil ingestion by children. Environ Res: 51(2): 147-162.

