page title goes here Risk Assessment
PRG Frequently Asked Questions (FAQ)
This page presents many questions asked by site users and responses. Please search this page for answers to your questions prior to contacting technical support staff. Researching the questions and answers posted here will greatly reduce the time it takes for you to solve many problems that arise from calculating and using this PRG site. If this is your first time using the PRG Calculator, it is strongly recommended that you first read "Radiation Risk Assessment At CERCLA Sites: Q & A".
- What are PRGs?
- What are PRGs used for?
- What are radionuclide slope factors (SF)?
- How should slope factors (SF) be used?
- How do PRGs differ from Regional Removal Management Levels (RML)?
- How do PRGs differ from cleanup standards?
- How often do you update the PRG Table?
- Can I get a copy of a previous PRG table?
- What ages and exposure routes are considered in each land use?
- How can I select more than one isotope at a time in the PRG Search page?
- How are the PRG results converted to a mass basis?
- How are the residential exposure durations (EDs) determined for carcinogenic (age-adjusted) exposures?
- How can I get the calculator results or the other web pages to print on one page?
- Do the PRGs take into account field survey or laboratory analytical approaches?
- Are the PRGs applicable to cleanup after a terrorist attack?
- Do the PRGs factor inhalation from Radon vapor intrusion?
- What is the preferred citation for information taken from this website?
- Where else can I go for toxicity studies (values) not on this site?
- Do the fish tissue and/or soil PRGs apply to wet-weight or dry-weight data?
- What do I do when the laboratory reports U-233/U-234 together as well as U-235/U-236 together?
- Do the resident produce, farmer produce, and farmer animal product intake rates represent the typical amount of homegrown food ingested by a single person?
- How does the peak risk rate (risk/year) relate to target risk and the Peak PRG?
- Are the future times given for some of the Peak PRGs, that are thousands to billions of years, meaningful?
- What is the purpose of the calculator opening a new tab after I hit each retrieve button?
- What are PRGs?
Preliminary Remediation Goals (PRGs) presented on this site are risk-based concentrations for the Superfund/RCRA programs. PRGs are derived from standardized equations combining exposure information assumptions with toxicity data. They are considered by the Agency to be protective for humans (including sensitive groups) over a lifetime; however, PRGs are not always applicable to a particular site and do not address non-human health endpoints such as ecological impacts. The PRGs contained in the PRG table are generic; that is, they are calculated without site-specific information. They may be re-calculated using site-specific data. Cancer slope factors (SFs) used are provided by the Center for Radiation Protection Knowledge. The main report is Calculation of Slope Factors and Dose Coefficients, and the tables of slope factors are in a separate appendix.
- What are PRGs used for?
They are used for site "screening" and as initial cleanup goals, if applicable. PRGs are not de facto cleanup standards and should not be applied as such. The PRG's role in site "screening" is to help identify areas, contaminants, and conditions that do not require further federal attention at a particular site. Generally, at sites where contaminant concentrations fall below PRGs, no further action or study is warranted under the Superfund program, so long as the exposure assumptions at a site match those taken into account by the PRG calculations. Chemical concentrations above the PRG would not automatically designate a site as "dirty" or trigger a response action. Exceeding a PRG, however, suggests that further evaluation of the potential excess lifetime cancer risk (ELCR) that may be posed by site contaminants is appropriate. PRGs are also useful tools for identifying initial cleanup goals at a site. In this role, PRGs provide long-term targets to use during the analysis of different remedial alternatives. By developing PRGs early in the decision-making process, design staff may be able to streamline the consideration of remedial alternatives.
- What are radionuclide slope factors?
Slope factors (SFs), for a given radionuclide, represent the excess lifetime cancer risk (ELCR) equivalent per unit intake (i.e., ingestion or inhalation) or external exposure of that radionuclide. These SFs are used to convert a radionuclide concentration in soil, air, water, or foodstuffs to a radiation ELCR. SFs are also called risk coefficients.
- How should slope factors be used?
The primary use of slope factors (SFs), also called risk coefficients, is to compute the excess lifetime cancer risk (ELCR) resulting from site-related exposures. This is accomplished by multiplying the route-specific SF by the chronic daily intake (CDI) of each radionuclide of potential concern for each route of exposure.
- How do PRGs differ from Regional Removal Management Levels (RMLs)?
Risk-based RMLs for carcinogens generally are based on a 1.0E-04 excess lifetime cancer risk (ELCR). RMLs typically are used to help define areas, contaminants, and conditions that may warrant an emergency or a time-critical removal action at a site. To develop RMLs based on the PRG calculator, we recommend either (1) change the TR (target risk) to 1.0E-4 on the calculator main page or (2) multiply the PRG results from the default tables on the PRG "Download" page by 100 to convert 1.0E-06 PRGs to 1.0E-04 PRGs. Most of the radionuclides under the Soil to Groundwater scenario use MCLs as a target protective level, so these two methods for adjusting PRG results would not apply.
- How do PRGs differ from cleanup standards?
PRGs are not de facto cleanup standards; however, they could be used to establish final cleanup levels for a site after a proper evaluation takes place. In the Superfund program, this evaluation is carried out as part of the nine criteria for remedy selection outlined in the National Oil and Hazardous Substances Pollution Contingency Plan (NCP). Once the nine criteria analysis is completed, the PRG may be retained as is or modified (based on site-specific information) prior to becoming established as a cleanup standard. This site-specific cleanup level is then documented in the Record of Decision.
- How often do you update the PRG Table?
The tables are updated when new toxicity values become available, exposure parameter values change, or a model is updated that impacts the default calculator results. There is no set schedule for these updates. Please take note of the "What's New" page to identify when these updates are incorporated.
- Can I get a copy of a previous PRG table?
We do not distribute outdated copies of the PRG table. Each new version of the table supersedes all previous versions. If you wish to maintain previous versions of the PRGs for a long-term project, you can download the entire table and save multiple versions with a time-stamp.
- What ages and exposure routes are considered in each land use?
The following table lists the land uses, media, and receptor ages utilized in the PRG calculator.
Land use Media Exposure Routes Oral Externala Inhalation Resident Soil Adult
ChildAdult
ChildAll Ages Tap Water Adult
ChildAdult
ChildAll Ages Air NA All Ages Adult
ChildFish All Ages NA NA Recreator Soil/Sediment Adult
ChildAdult
ChildAll Ages Surface Water Adult
ChildAdult
ChildNA Air NA All Ages Adult
ChildGame & Fowl
ConsumptionAll Ages NA NA Farmer Soil Adult
ChildAdult
ChildAll Ages Tap Water Adult
ChildAdult
ChildAll Ages Air NA All Ages Adult
ChildBiota
ConsumptionAdult
ChildNA NA Outdoor Worker Soil Adult Adult Adult Air NA Adult Adult Indoor Worker Soil Adult Adult Adult Air NA Adult Adult Composite Worker Soil Adult Adult Adult Air NA Adult Adult Construction Worker Soil Adult Adult Adult Air NA Adult Adult Soil to Groundwater Soil Adult
ChildAdult
ChildAll Ages NA = Not Applicable
a. The external exposure routes include: external exposure to ionizing radiation in soil, submersion in air, and immersion in water. - How can I select more than one isotope at a time in the PRG Search page?
To select more than one isotope you can:
- Left click and hold the button down while dragging the mouse pointer up and down through the isotope list,
- Hold the control (Ctrl) key down while left clicking on the isotopes desired, or
- Click in the "Select All" box to the bottom right of the isotope list.
- How are the PRG results converted to a mass basis?
Appendix B of the Soil Screening Guidance for Radionuclides Technical Background Document presents a formula to convert PRGs in pCi/g to mg/kg and also a formula to convert pCi/L to mg/L. The equation is reproduced here with similar conversions for mg/m3 and mg/cm2.

The derivation of the 2.8 × 10⁻¹² and the 2.8 × 10⁻¹⁵ conversions are presented below.

Combination of the derivation of the conversions with the isotope-specific half-life and atomic weight is presented here.

- How are the residential exposure durations (EDs) determined for carcinogenic (age-adjusted) exposures?
Residential exposure duration (EDres) is set at 26 years, according to an OSWER directive based on the 2011 version of the Exposure Factor's Handbook. When evaluating carcinogenic exposure, intakes are age-adjusted to account for exposure as a child and an adult within the 26 years. The OSWER directive sets child exposure at 6 years (EDres-c). Therefore, EDres - EDres-c = 20 years of adult exposure (EDres-a). For this tool, child intakes are used with EDres-c and adult intakes are used for EDres-a.
- How can I get the calculator results or the other web pages to print on one page?
Output links for PDF and Spreadsheet files can be found at the top of the calculator results page. The HTML results are not suited for formatting to print on a single page but are rather designed for ease of use on the screen.
- Do the PRGs take into account field survey or laboratory analytical approaches?
No, the PRGs are a risk-based tool only, except for the Soil to Groundwater scenario, which is usually based on MCLs. Determining the extent of contamination is a separate process during the Remedial Investigation or Feasibility Study (RI/FS) and remedial design processes. It is important for remedial decision data to be of known and acceptable quality. The determination of what data are needed is a site-specific decision, and it is the responsibility of the Remedial Project Manager (RPM) to use the tools that are most appropriate for that situation. This analysis indicates that concentrations derived with the PRG calculator that fall within the 10-4 to 10-6 excess lifetime cancer risk (ELCR) range are measurable.
- Are the PRGs applicable to cleanup after a terrorist attack?
Responses to radiological and nuclear terrorist incidents is addressed in an August 1, 2008, guidance issued by the Department of Homeland Security (DHS) in the Federal Register (Vol. 73, No. 149, pp 45029 - 45049), Planning Guidance for Protection and Recovery Following Radiological Dispersal Device (RDD) and Improvised Nuclear Device (IND) Incident. The DHS guidance uses Operational Guidelines from the Department of Energy to guide the early and intermediate phases of response to an RDD and an IND. Under the guidance, the late-phase generally would utilize an optimization process to site-specifically decide on an approach for addressing the remaining residual contamination. Normally, the PRG calculator would be used only if the optimal process for the late-phase was a Comprehensive Environmental Response, Compensation, and Liability Act (CERCLA) approach. As at a CERCLA site, the user at an RDD or IND site can choose to modify the standard default PRG exposure parameters to calculate site-specific PRGs. The characteristics of an RDD or IND site may warrant the use of site-specific assumptions that differ from the PRG defaults. The site manager should weigh the cost of collecting the data necessary to develop site-specific PRGs with the potential for deriving a higher PRG that provides an appropriate level of protection.
- Do the PRGs factor inhalation from Radon vapor intrusion?
Air PRGs represent preliminary remediation goals for indoor and outdoor air. The residential and industrial air PRG values can be used to determine preliminary remediation goals that are detected in the air (e.g., indoor and outdoor) from a variety of sources. There are no PRGs specific to the vapor intrusion pathway (i.e, for subsurface sources that may contribute to indoor air contamination). EPA's Radon Vapor Intrusion Screening Level (RVISL) calculator is expected to be released soon. For guidance on vapor intrusion assessment, see EPA's Vapor Intrusion Site. The OSWER Technical Guide For Assessing And Mitigating The Vapor Intrusion Pathway From Subsurface Vapor Sources To Indoor Air (OSWER Publication 9200.2-154; June 2015) can be found there among other resources and information.
- What is the preferred citation for information taken from this website?
United States Environmental Protection Agency. Preliminary Remediation Goals for Radionuclide Contaminants at Superfund Sites. (insert date accessed and url).
- Where else can I go for toxicity studies (values) not on this site?
Many other websites host toxicity information from other countries and other government agencies similar to this EPA site. The Risk Assessment Information System (RAIS) at http://rais.ornl.gov/ presents toxicity values and toxicity study information. Websites of other governmental agencies are also useful. Call the U.S. EPA Superfund Health Risk Technical Support Center at (513) 569-7300 and ask for toxicity values. Call the ATSDR Information Center toll-free at 1-888-422-8737 for toxicity values and profiles.
- Do the fish tissue and/or soil PRGs apply to wet-weight or dry-weight data?
The fish PRGs represent the concentration that can be consumed at the rate indicated in the Technical Background Document. Therefore, wet or dry weight is not an inherent assumption of the PRG numbers. Rather, users of the Table should consider whether their population of interest is more likely to consume the fish using a preparation method that is better simulated by a wet or dry weight. (For example, consumption of raw or fried fish would be more likely represented by wet weight, whereas consumption of smoked or dried fish might be better represented by dry weight.) In other words, the use of a site-specific sample as wet or dry weight should be governed by its representativeness for the population of interest. The PRG Calculator does not provide default fish PRGs under residential. If the fish scenario is selected under residential, the calculator will automatically switch to site-specific mode. On the next page, the user is required to enter a site-specific fish consumption rate. The previous default fish intake rate of 54,000 mg/day from the Standard Default Exposure Factors has been removed. Intake rates can be found in the 2011 Exposure Factors Handbook. Please consult your Regional risk assessor when determining appropriate fish consumption rates. The soil PRGs are based on dry weight, because the soil intake rates are based on dry weight. Most soil data is typically reported as dry weight. As always, please consult your Regional risk assessor when applying the PRGs to site-specific data.
- What do I do when the laboratory reports U-233/U-234 together as well as U-235/U-236 together?
These isotope pairs have overlapping energy lines, making it difficult for the lab to distinguish between the two; however, when submitting the media to the lab for analysis, one can request discrete analysis if necessary to determine exactly what isotopes are present at a site. The lab will require instruments of high abundance sensitivity and highly sensitive detection systems. If you already have data in this format and there is no more media for the lab to analyze there are a couple options to consider.
- If you have no knowledge of the site history, you could assign the lab value to each isotope. For screening against PRGs this is reasonable. If one or both fail the screen, the next step in the risk assessment process is to calculate an exposure point concentration and then calculate the risk. At this point if one or the other or both isotopes are driving the risk, it would become necessary to reanalyze the media to get separate activity levels.
- If you have some site knowledge and do not believe that uranium was used at your site, you could rely on the natural abundance percentages of each isotope to assign a discrete activity. The natural abundance percentages of U-233 and U-236 are less than 0.00001%. U-235 and U-234 natural abundance is reported to be approximately 0.7% and 0.005%, respectively. The exact abundance varies regionally. In a situation where uranium was not used at a site, one could assume 100% is U-234 and U-235. U-233 was enriched at some facilities for use in experimental reactors. U-236 is the first progeny of Pu-240. Pu-240 is a waste product of breeder reactors attempting to generate Pu-239 for the production of nuclear weapons or use in reactors.
- Do the resident produce, farmer produce, and farmer animal product intake rates represent the typical amount of homegrown food ingested by a single person?
No, the resident and farmer homegrown food defaults are not intended to represent a typical gardener or farmer. There is a large variability of the types and amounts of food that are homegrown across the country, which can be affected by factors such as climate and lot size. To allow for broad applicability of this calculator to many site situations, intake rates were developed for all produce and animal products for which the Exposure Factors Handbook (EFH) had intake rates for homegrown biota. As stated in section 4 of the user guide, users should note that if a route of exposure (e.g., ingesting fin fish from the pond in the farmer soil exposure scenario) is considered to be unreasonable at their site, both currently and in the future, they may eliminate the route in the site-specific option by entering zero for the intake rate of that route (e.g., replacing default fin fish intake rates in farmer soil scenario of 155.9 and 36.1 g/day with 0.0) or the intake rates may be modified to fit the site.
Moreover, in site-specific mode users can choose which produce and animal products to include in the assessment as well as select an appropriate climate zone and soil type that is reasonable for the given region. To determine which produce are commonly cultivated in the area around the site, users should contact their county extension office. The National Pesticide Information Center has an interactive map that allows users to choose their state and county; then connects them to their county extension office. In addition, a local food survey can be conducted. Much of the methodology in the Guidance for Conducting Fish and Wildlife Consumption Surveys may be useful for surveying produce consumption to determine site-specific food intake rates.
Section 2.5.5 of the user's guide presents the caloric values of the produce and animal products included in the resident and farmer land uses. Knowledge of the caloric intake can be helpful in determining the expected yield from a site's size. For instance, it may be unreasonable to expect an acre of land to sustain both livestock and a garden large enough to support subsistence farming.
- How does the peak risk rate (risk/year) relate to target risk and the Peak PRG?
Peak risk rate (risk/yr) = Total risk for the one-year period in which the ELCR is greatest for a parent and all progeny, considering the scenario inputs, routes of exposure, and toxicity.
Peak risk interval = the time period in years (exposure duration, ED) encompassing the peak risk rate with the maximum risk across all possible intervals with the exhaustion of decay.
TR = target risk for selected scenario.
Peak PRG = the concentration at which the parent and progeny achieve the TR within the peak risk interval.
Consider the plot below for Ra-226 default soil ingestion peak PRG for a composite worker. The peak risk rate is the maximum sum of the risk contribution from all chain members for a year. To calculate the risk contribution of the chain members, determine the activity by decaying the parent and ingrowing progeny for all time using a Bateman equation decay solver. The Bateman equation describes the abundances and activities of all members of the decay chain as a function of time, based on the decay rates and initial abundances. Beginning with one unit activity for the parent (e.g., 1 pCi), the fractional activity relationship of the progeny to the parent is determined as a function of time. Once the activity over time is known for all chain members, it is converted to an annual risk using the toxicity values and exposure parameters of the land use chosen by the user for each exposure route. See the equation below. The activities determined by the Bateman equation have been converted to risk rates (risk/yr) as seen in the plot. The largest risk peak is identified as the peak risk rate (risk/year).
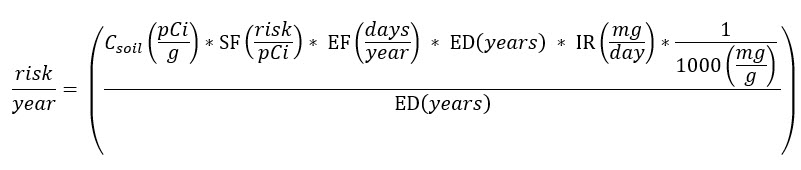
Where:
Csoil is the activity determined by the Bateman equation solver for any given time point.The exposure duration for the chosen land use is used to establish a time interval spanning the peak risk start (PST) and end time (PET). The shaded blue column describes this interval. Within the blue column, the area under each chain member's curve is summed to give a total fractional unit risk for the exposure duration. To find this peak interval, the solver iterates across all time points from T0 (now) through Tn (1E+12 yrs) with a quadratic function of activity and time.
Once the peak risk start- and end- times are known, the Peak PRG is calculated by normalizing the risk rates to the target risk across the peak exposure duration interval.
The final piece in calculating the Peak PRG is to take the inverse reciprocal of the sum of average activities divided by the standard chain member PRGs (no decay).
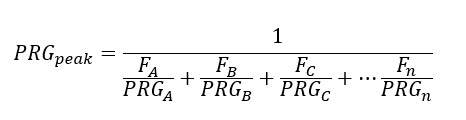
Where:
PRGA-n are the standard PRGs calculated without decay for each chain member
n is the total number of radionuclides in the decay chain
FA-n are the average fractional activities of each chain member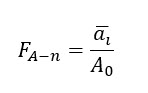
Where:
āi is the average activity of the ith chain member during the peak exposure duration
A0 is the initial unit activity of the parent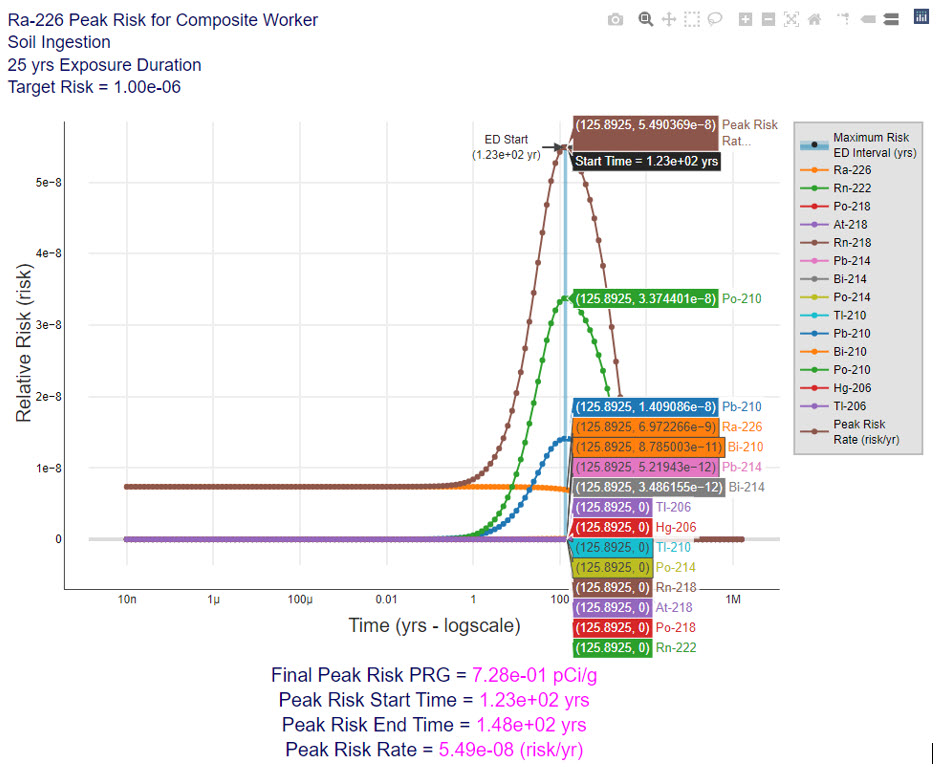
- Are the future times given for some of the Peak PRGs, that are thousands to billions of years, meaningful?
Yes, they are meaningful in that the time frame offers understanding and knowledge for making decisions on waste disposal and site remediation. The risk standard at the site may have a set time period for the risk assessment. If the risk-based standard does not have a set time period for the risk assessment, then the decision to utilize a time period other than Peak Risk may be made using professional judgement and justified based on the circumstances at the site (e.g., type of remedial action, radionuclides of concern).
- What is the purpose of the calculator opening a new tab after I hit each retrieve button?
Previous iterations of the calculator would display every page (i.e., main, site-specific input, and results pages) in the same browser tab after clicking the “Retrieve” button. Two issues arose from this single tab method.
- Certain browsers would not remember the radionuclides in the pick list when using the browser back button to add forgotten radionuclides.
- Certain browsers would not remember, or correctly display, the site-specific exposure parameters when using the browser back button to change values. This resulted in screening levels being calculated that did not match the input parameters. While the calculations would be correct, the results would not reflect the desired changes to the inputs after using the back button.
Prior to the multiple tab method, users had to start from the initial calculator input page and manually enter radionuclides and then reenter their exposure parameters on the site-specific page, for each calculator run. With the new method, if a user wants to change the radionuclides being assessed or the exposure parameters being used, they simply go to the previous tab and make the necessary changes and click the “Retrieve (new window)” button. For users who have to build the same picklist over and over, having the radionuclides remembered in the calculator main page tab will save time. For users doing site-specific exposure assessments, the screening levels calculated will always match the input parameters because the browser back button is no longer an option.